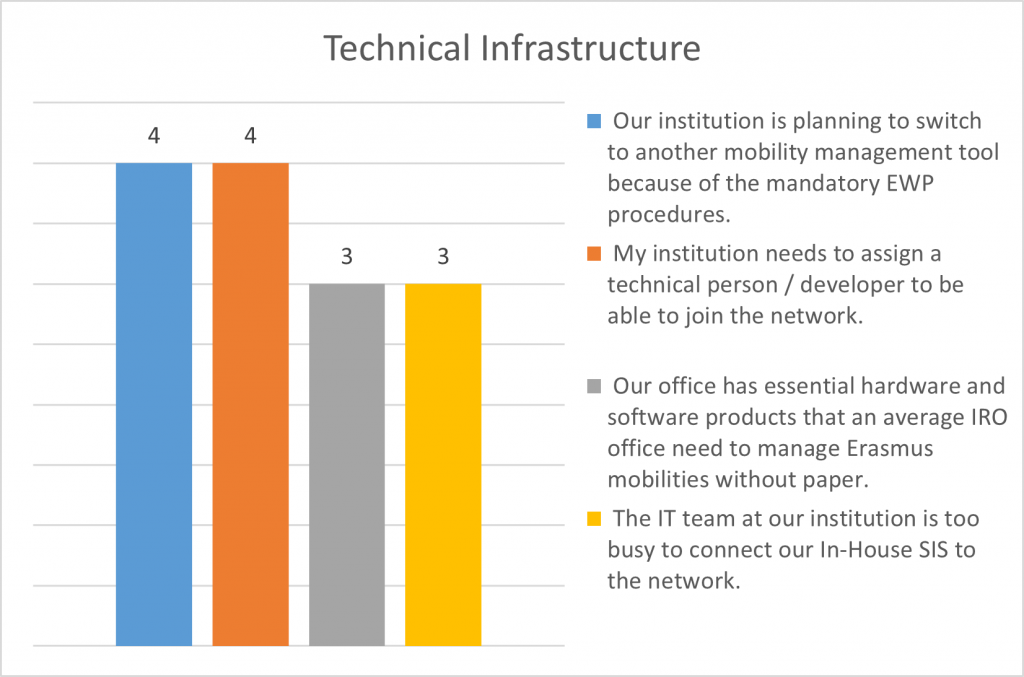
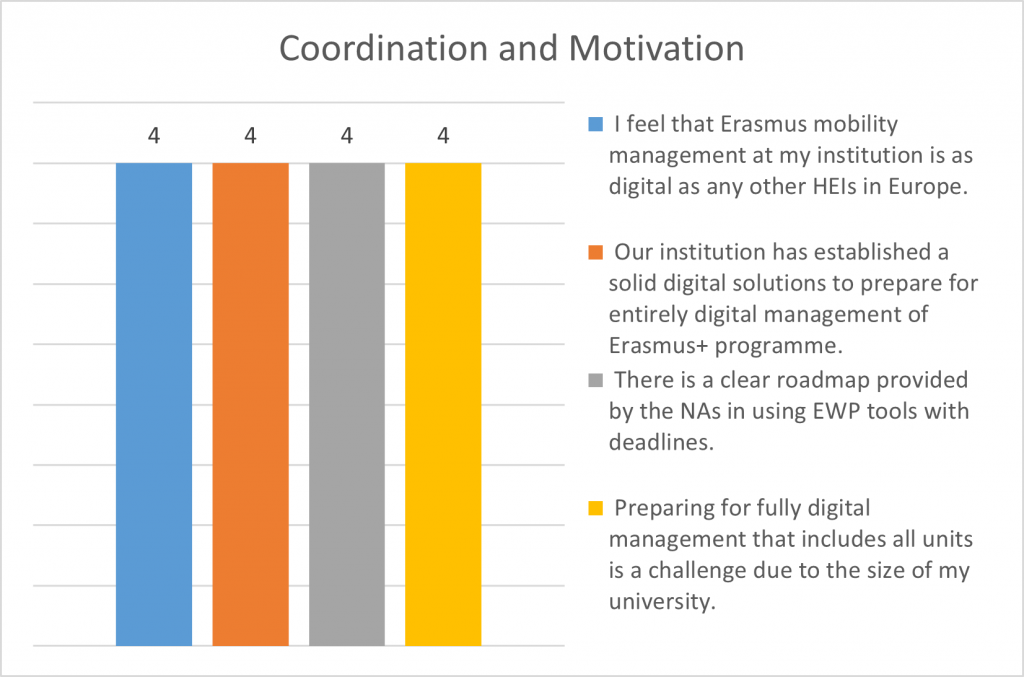
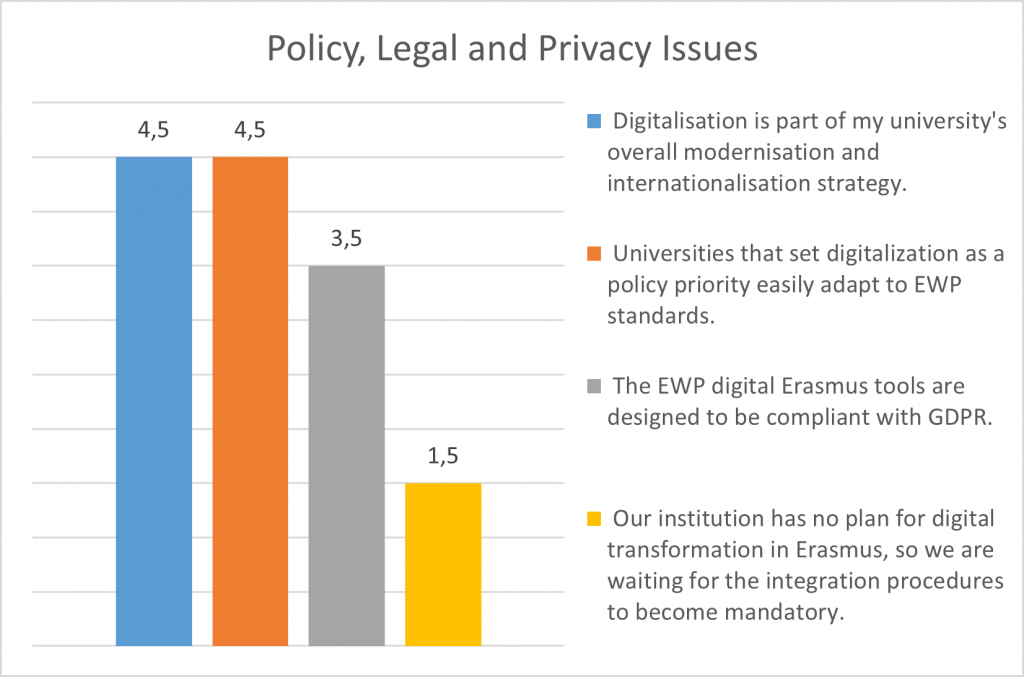
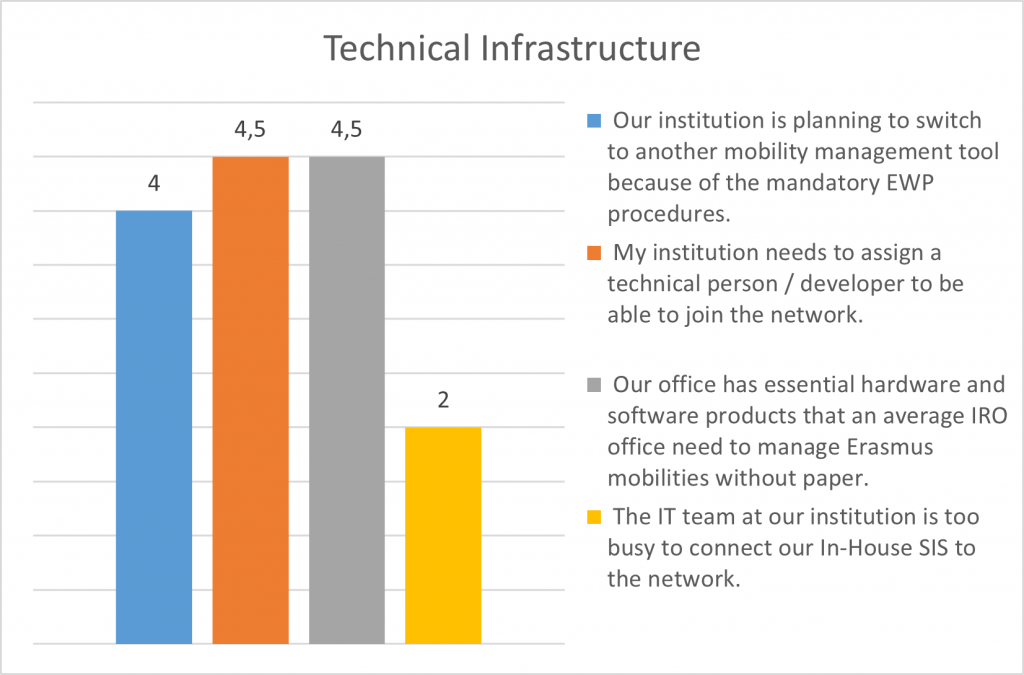
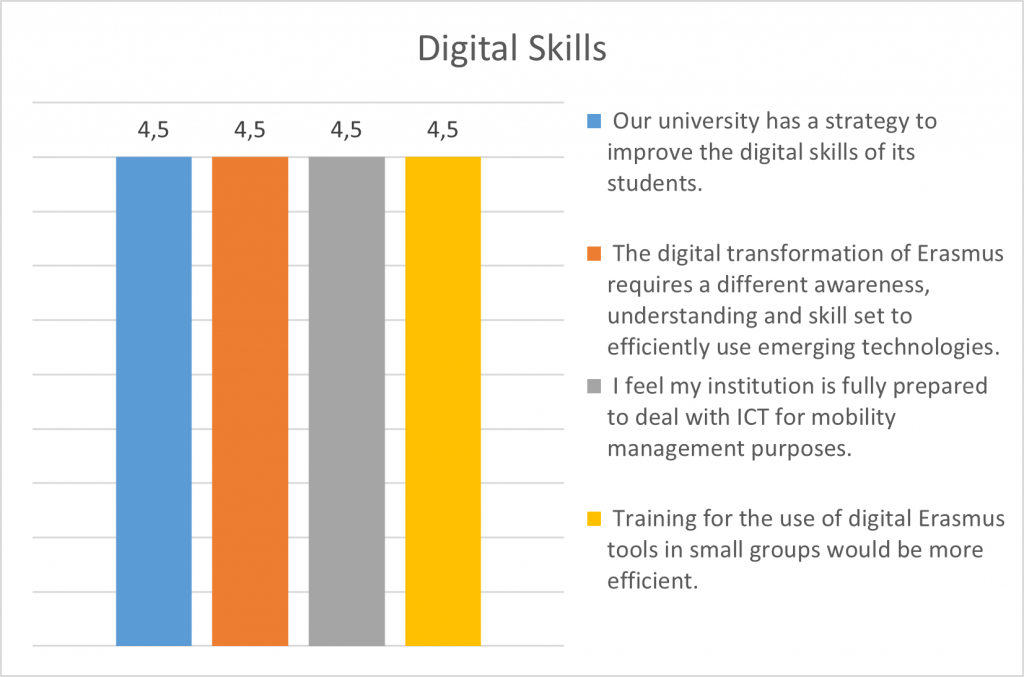
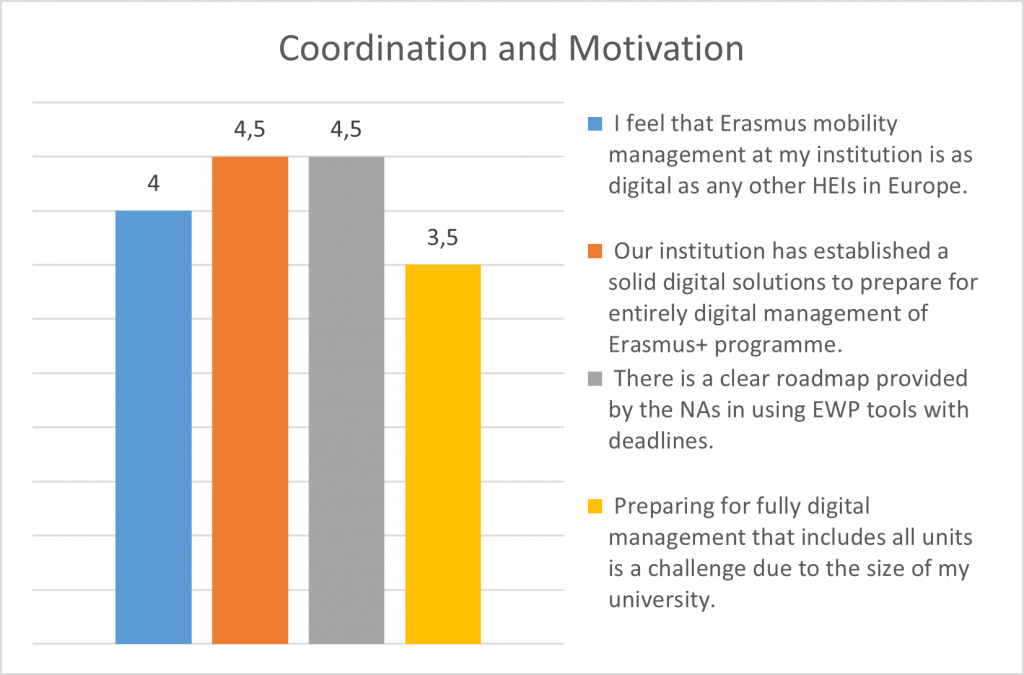
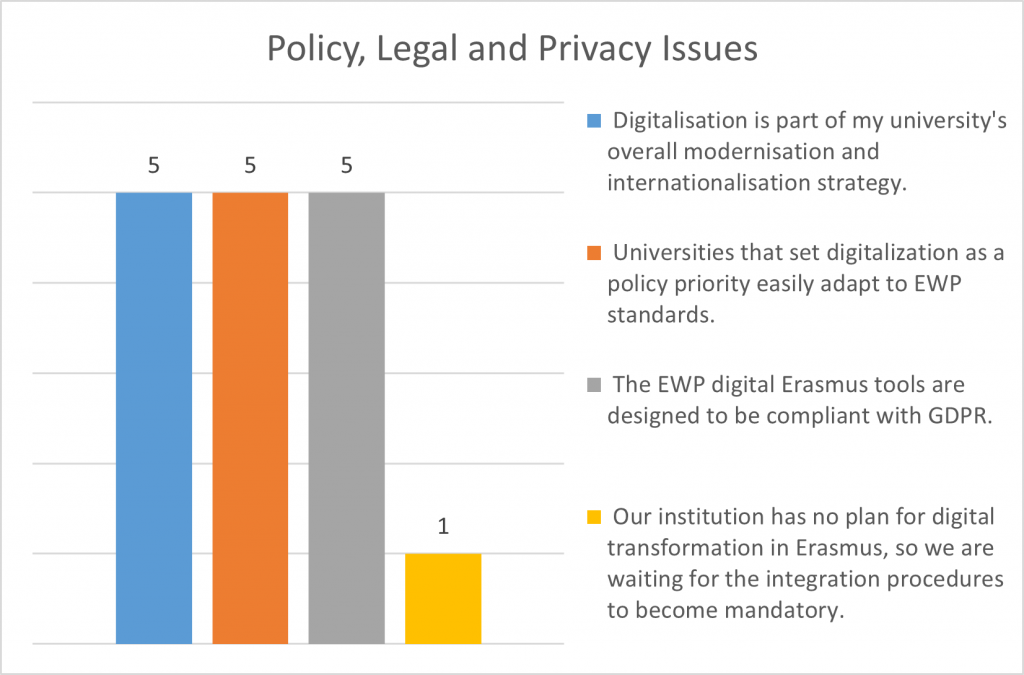
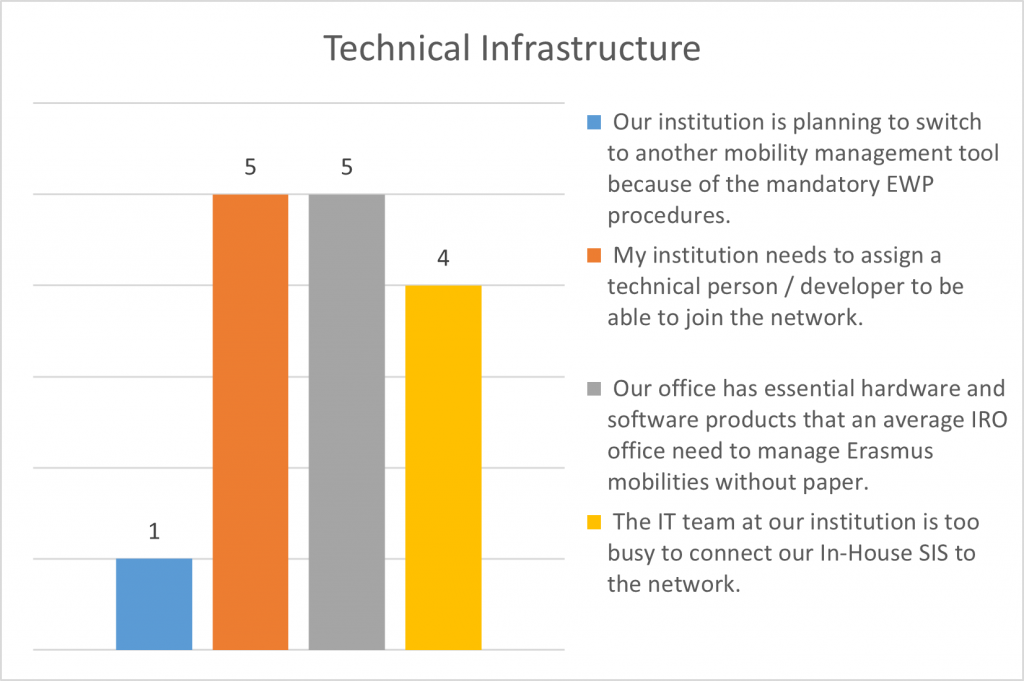
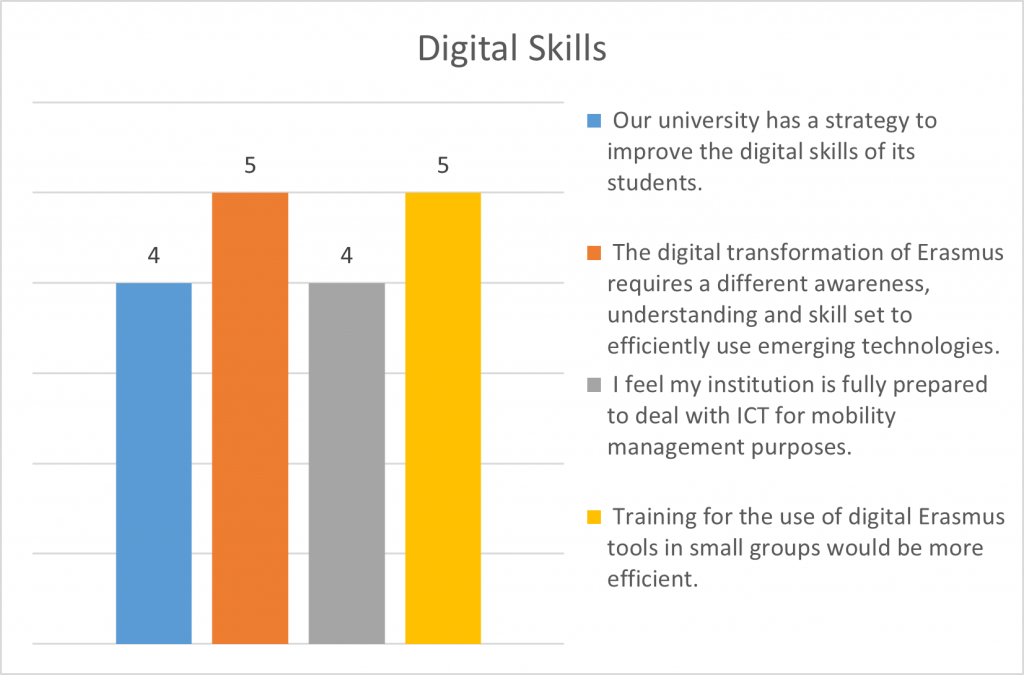
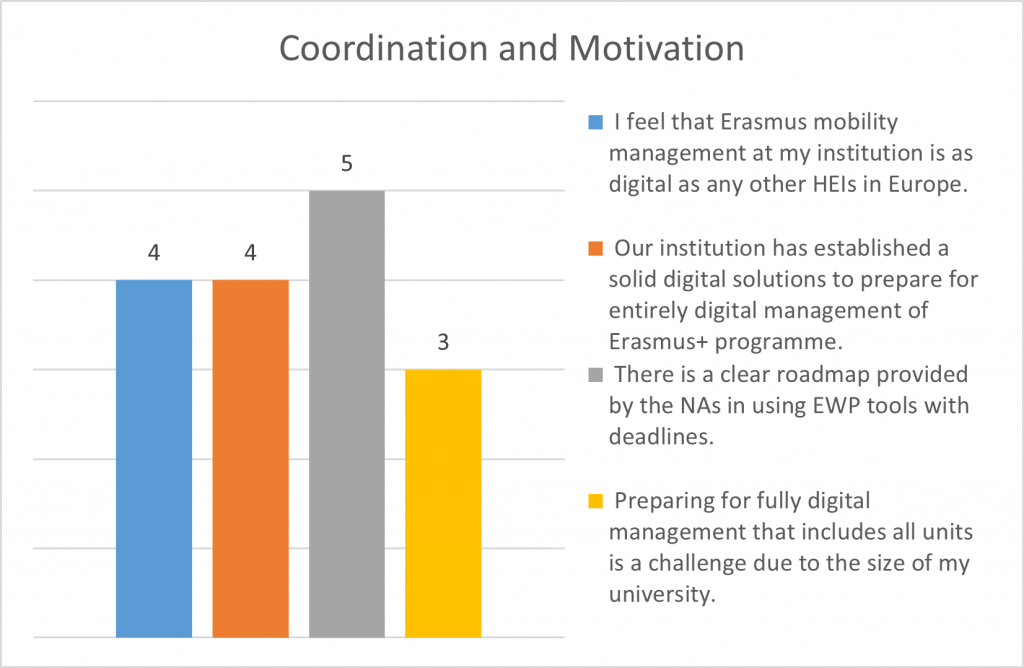
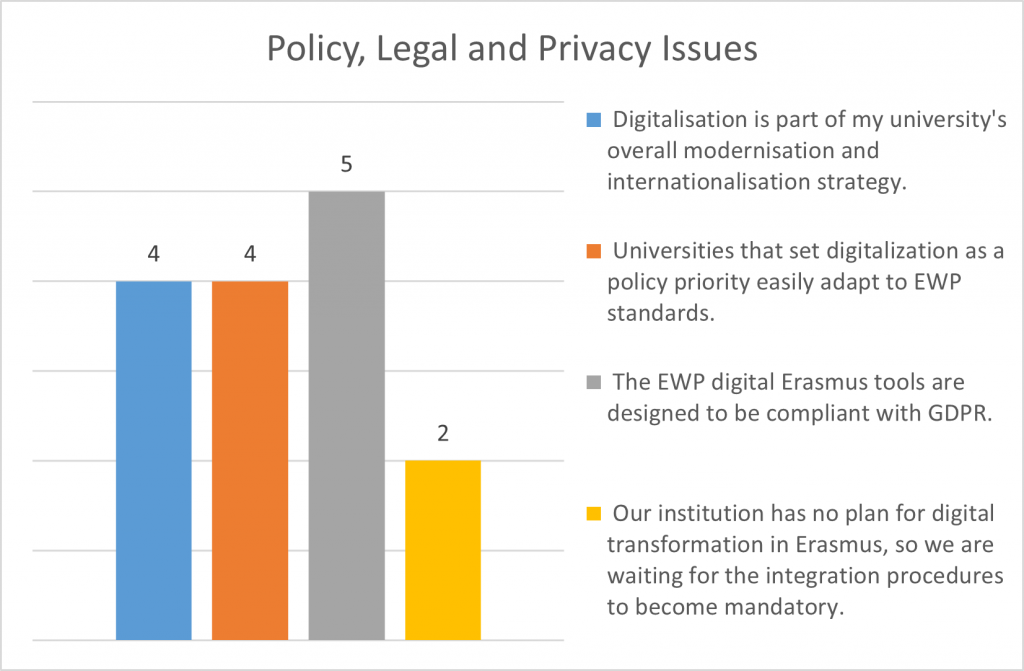
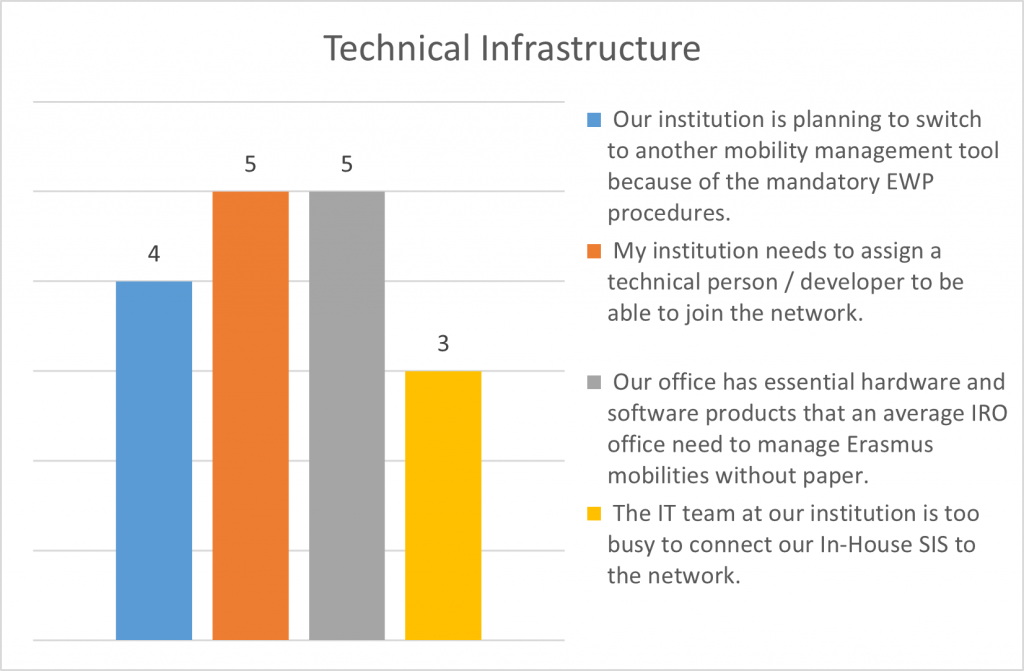
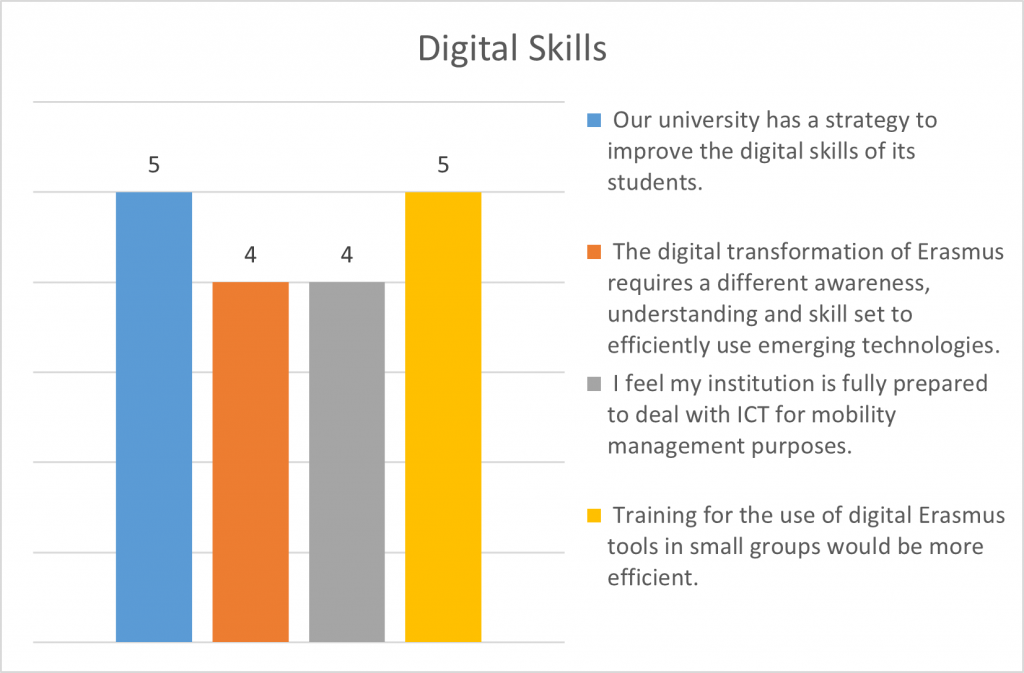
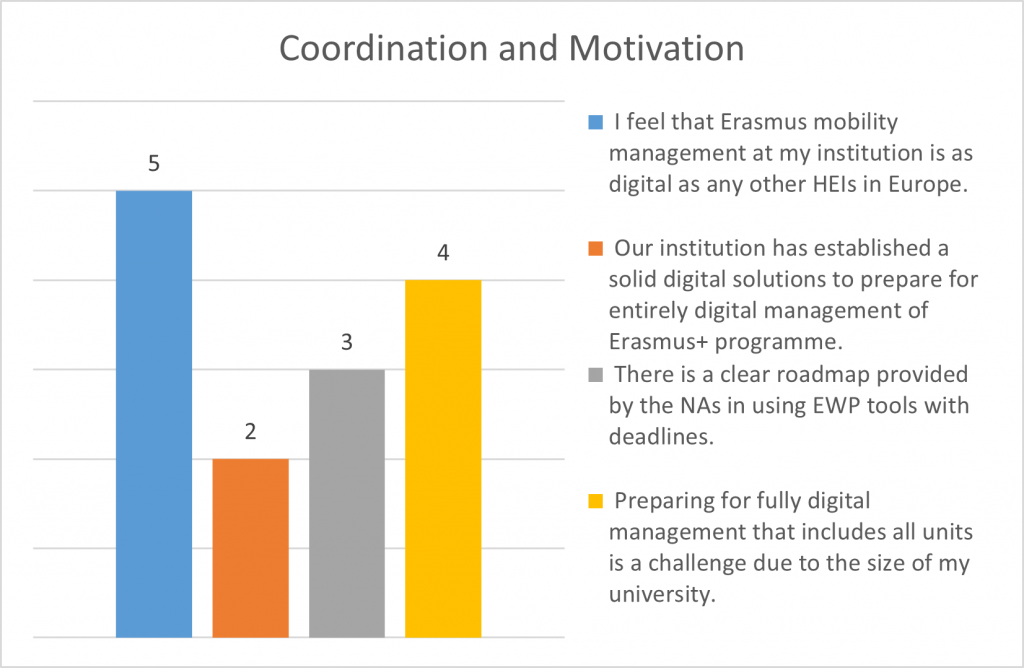
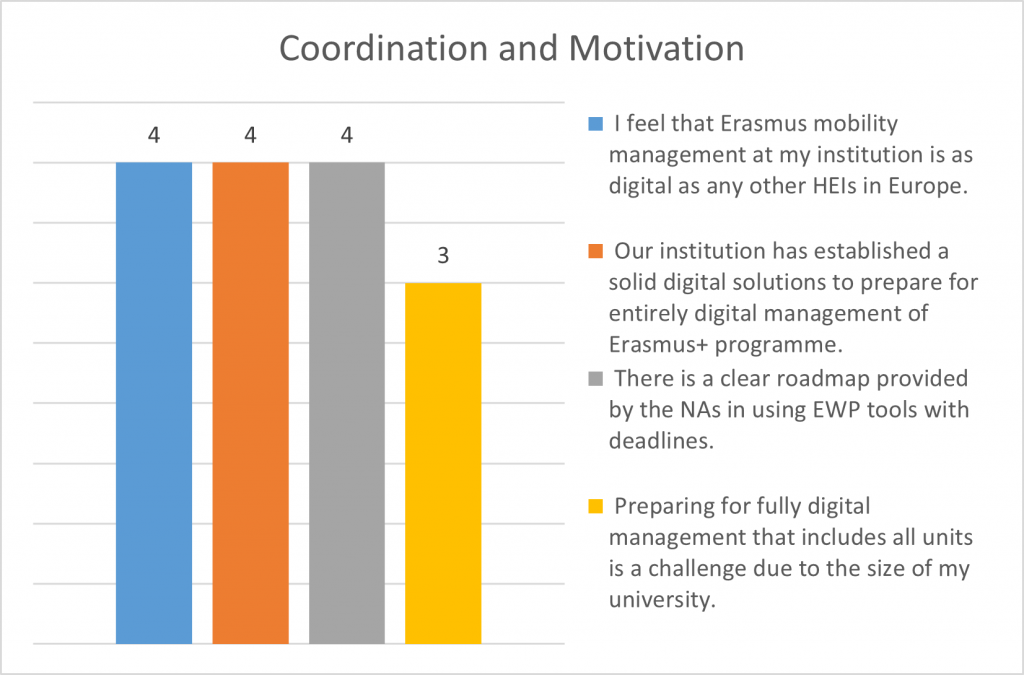
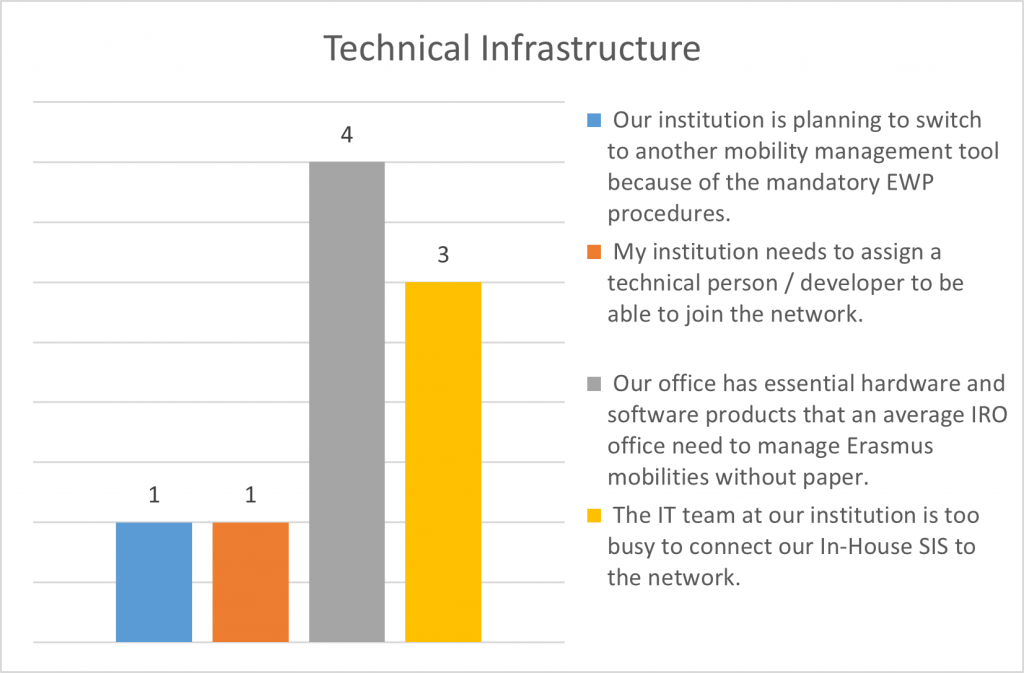
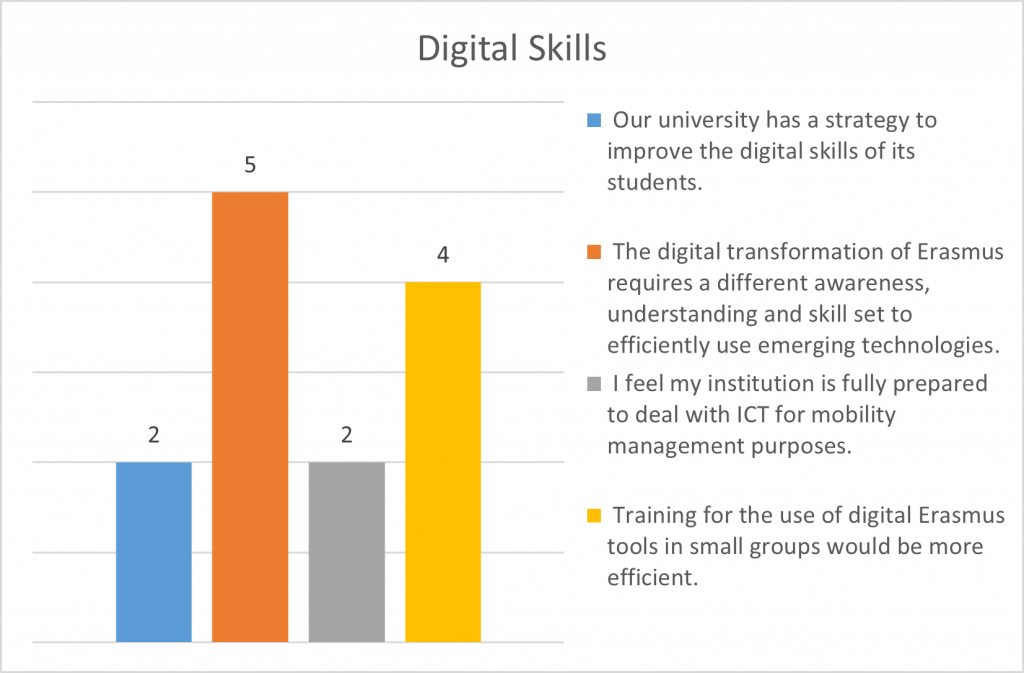
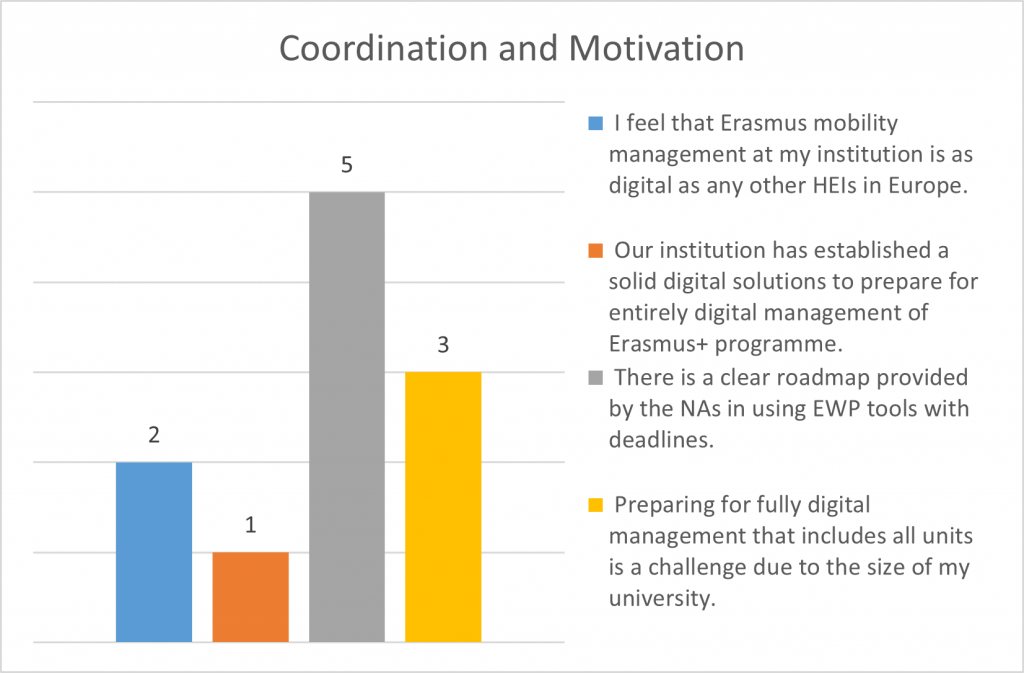
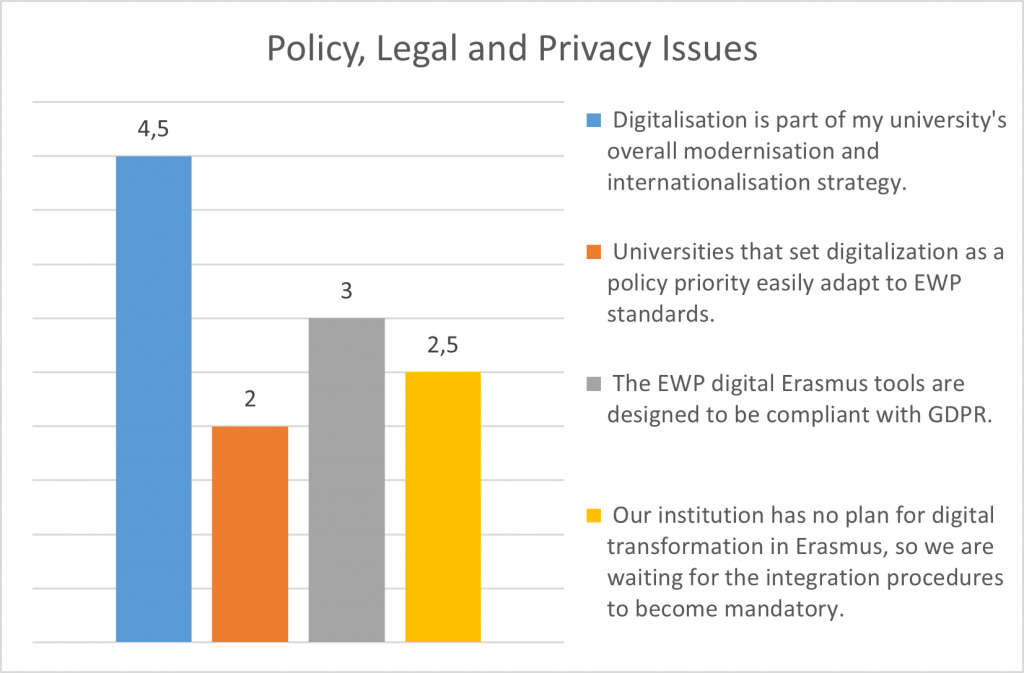
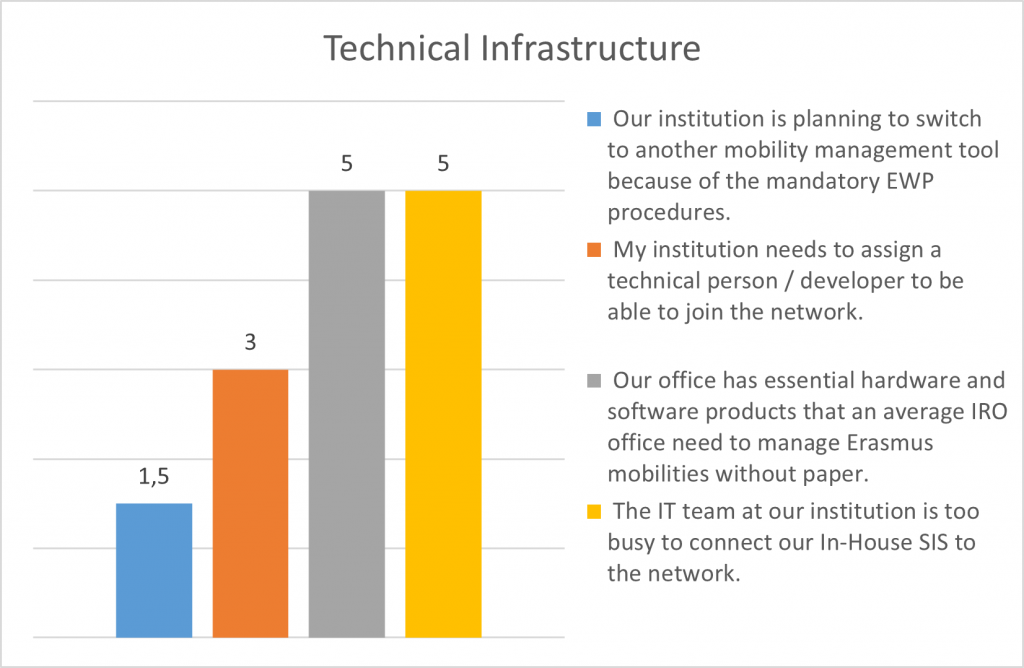
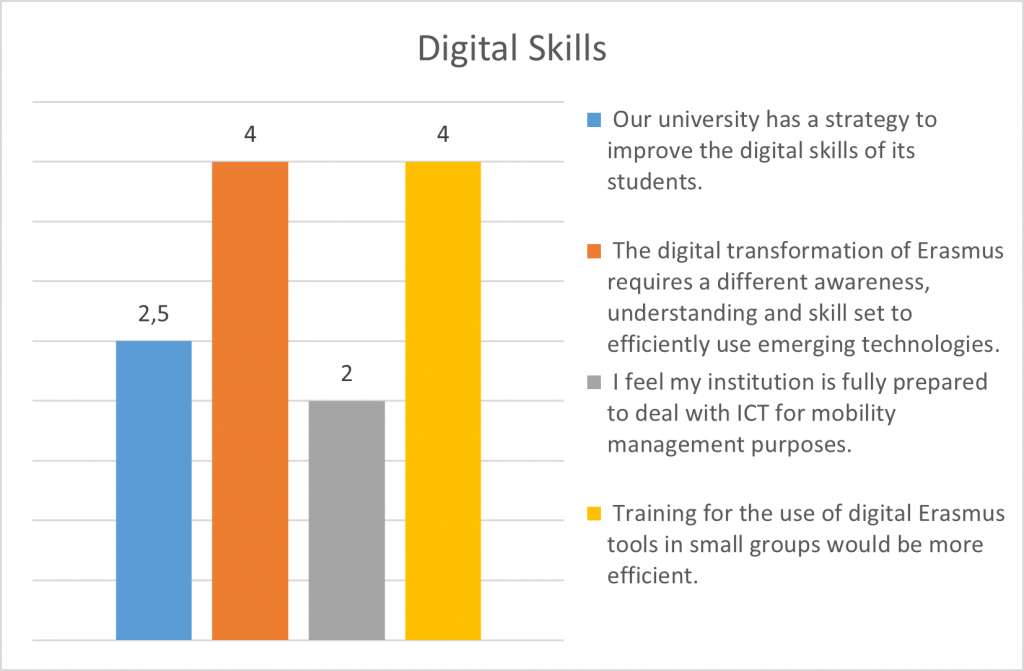
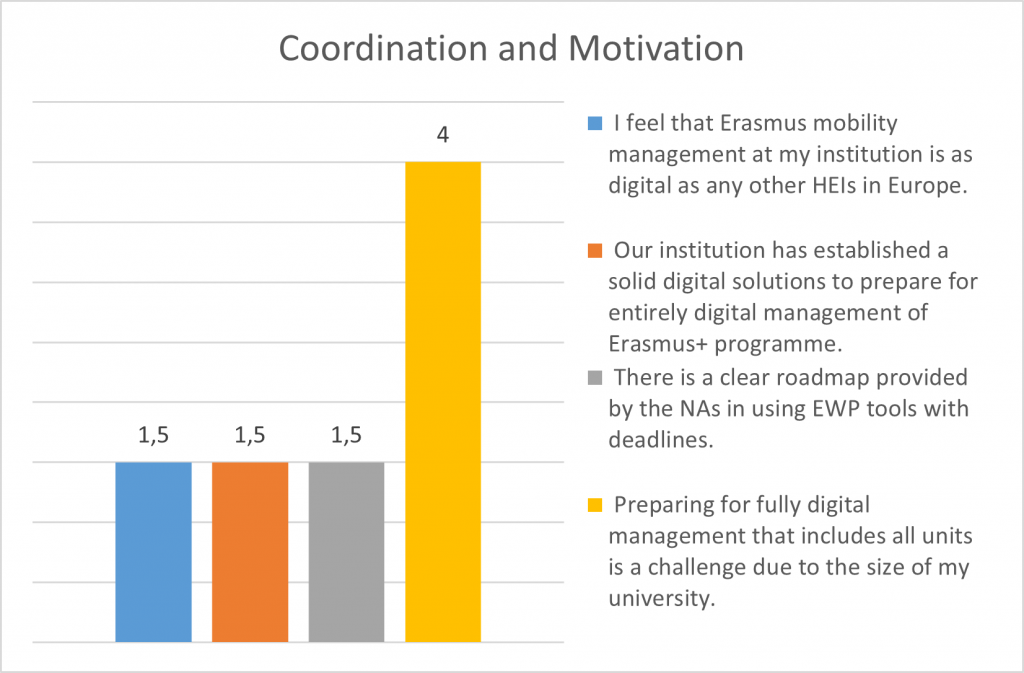
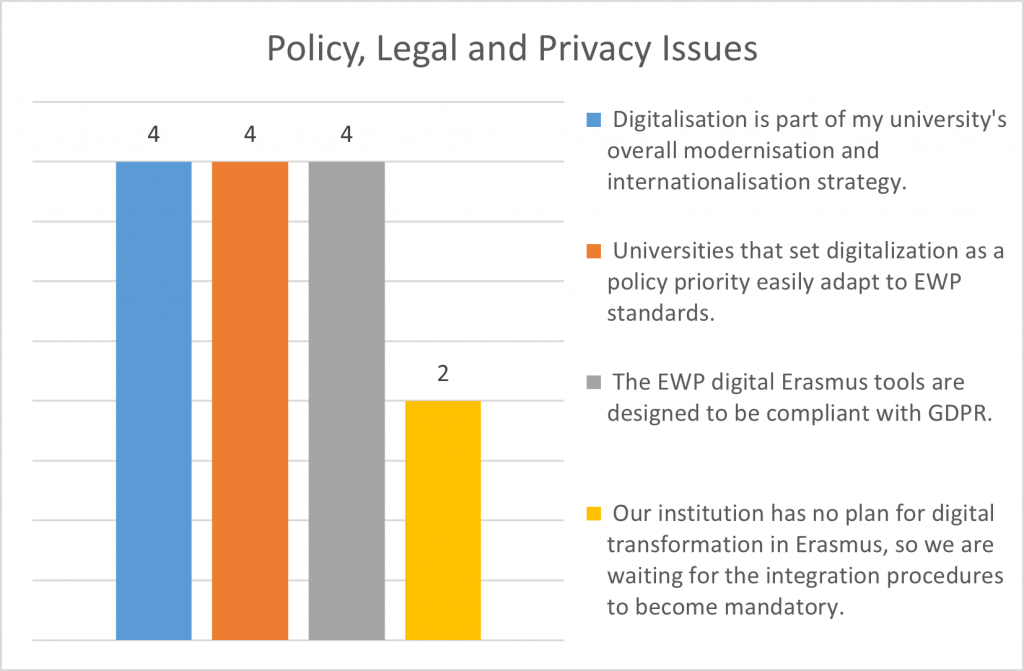
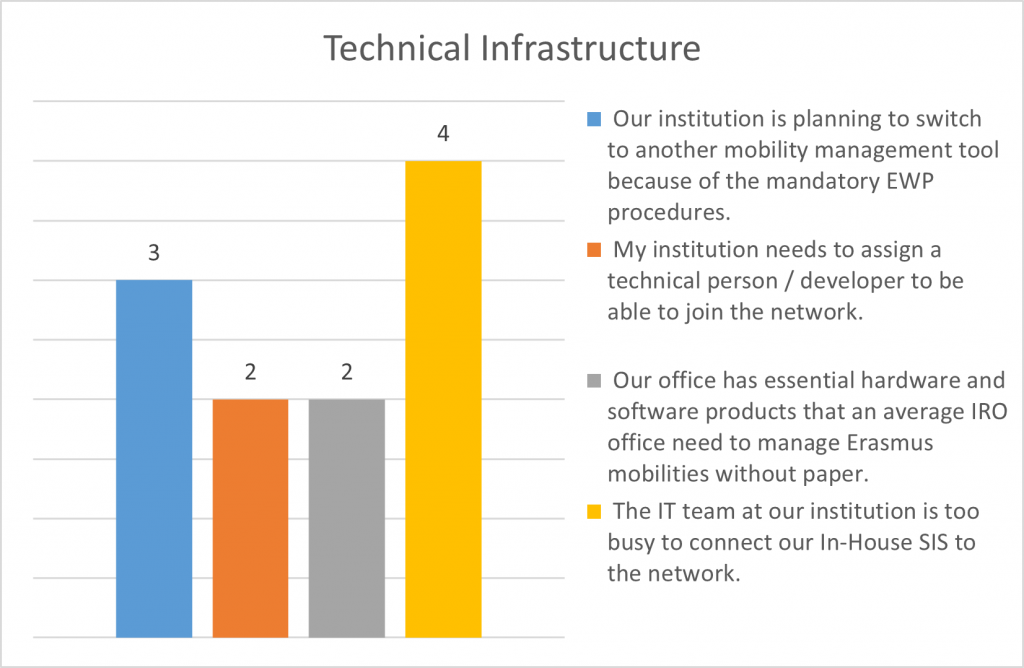
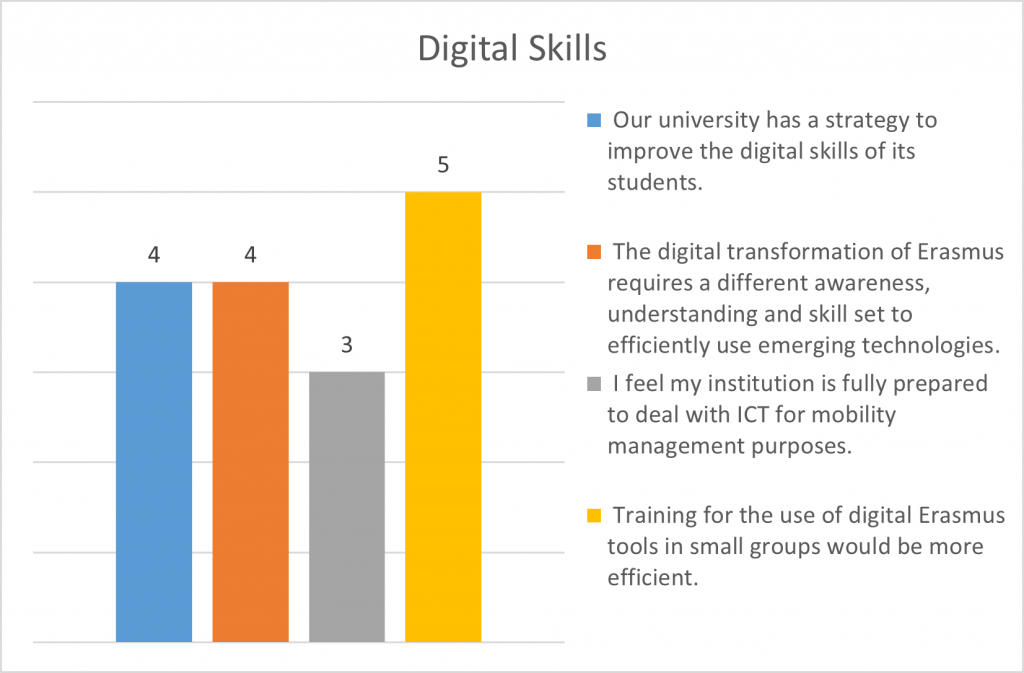
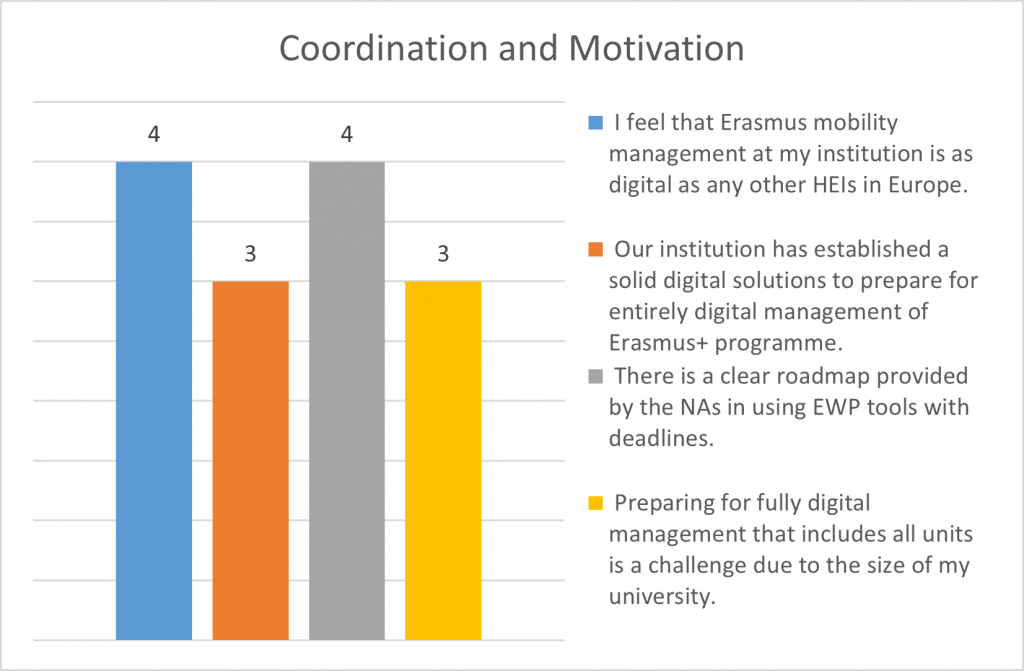
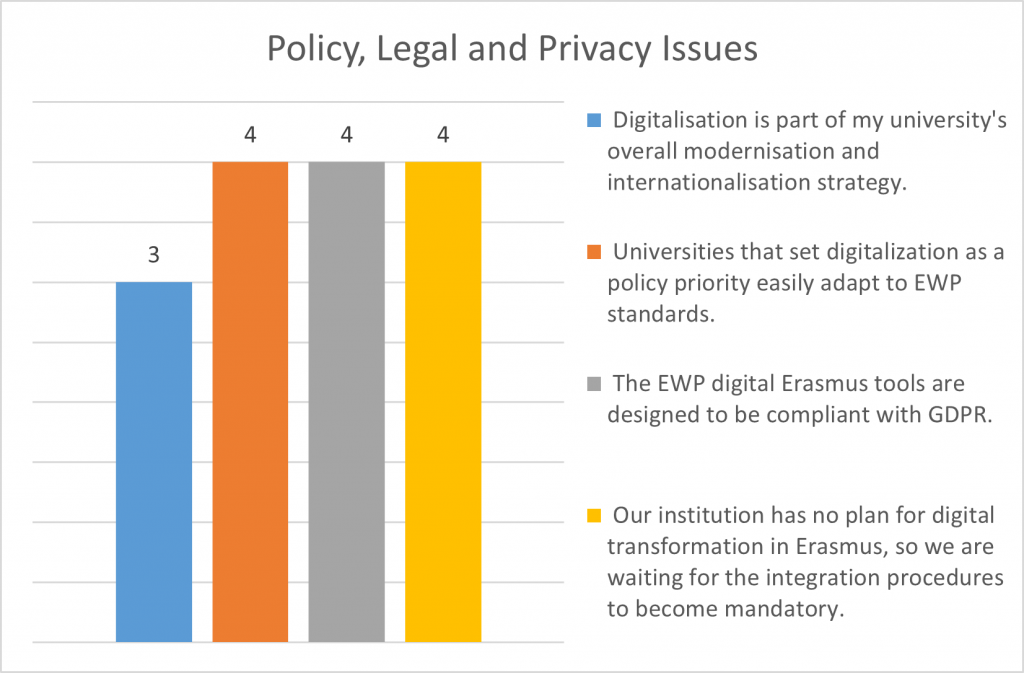
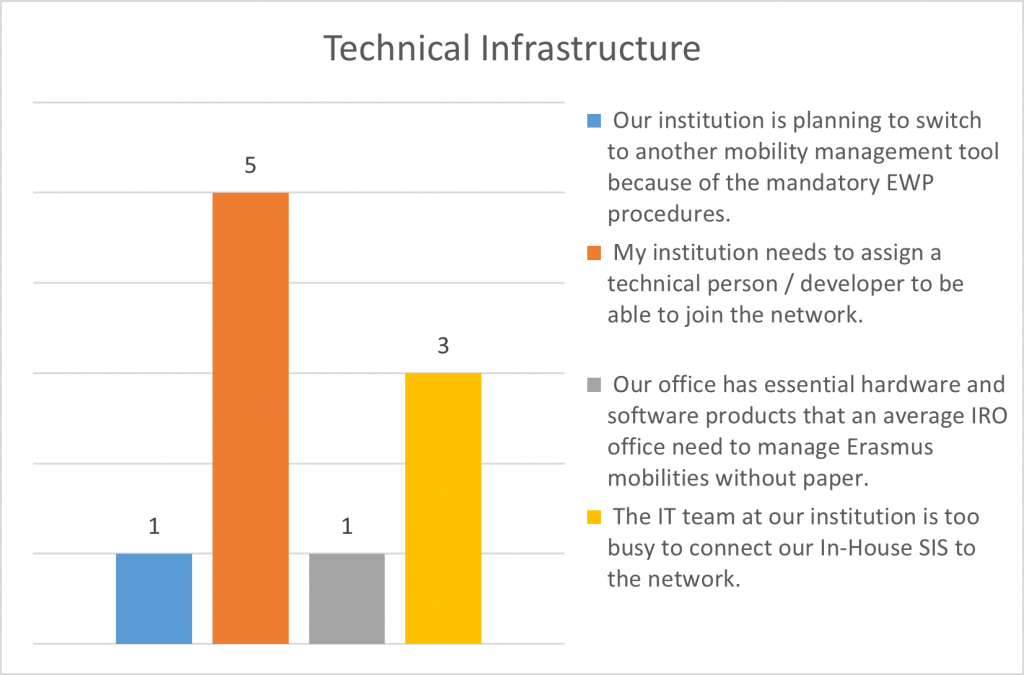
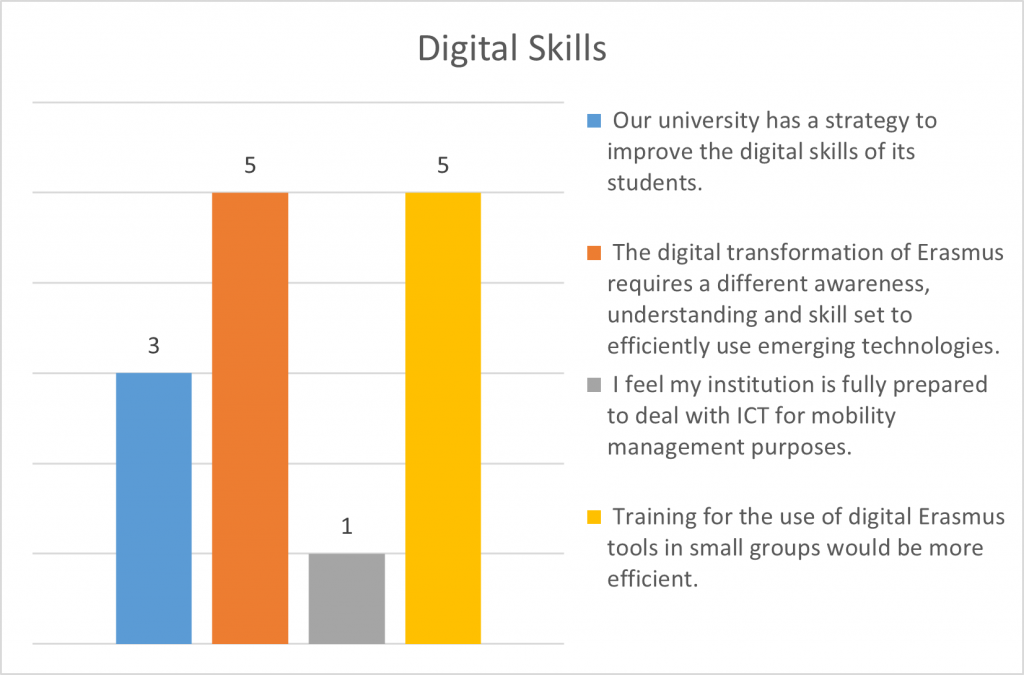
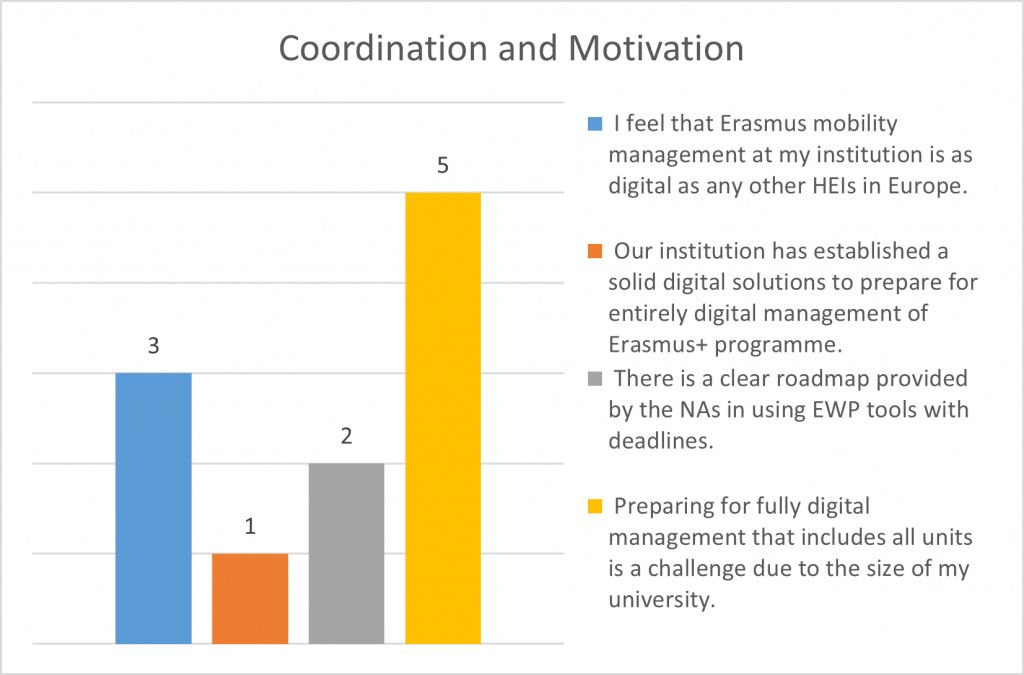
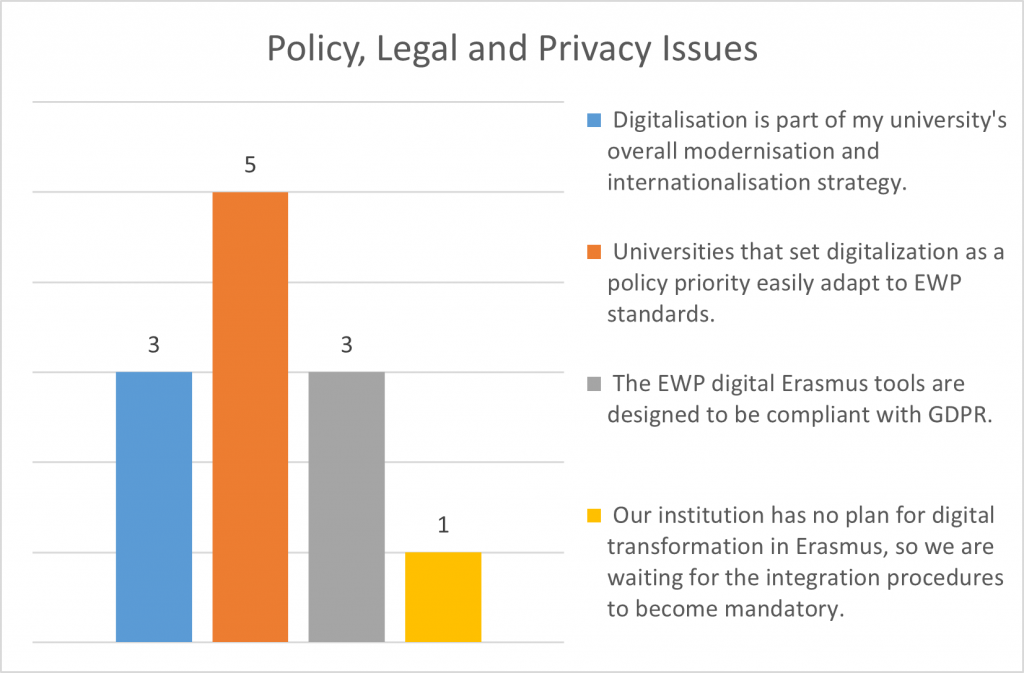
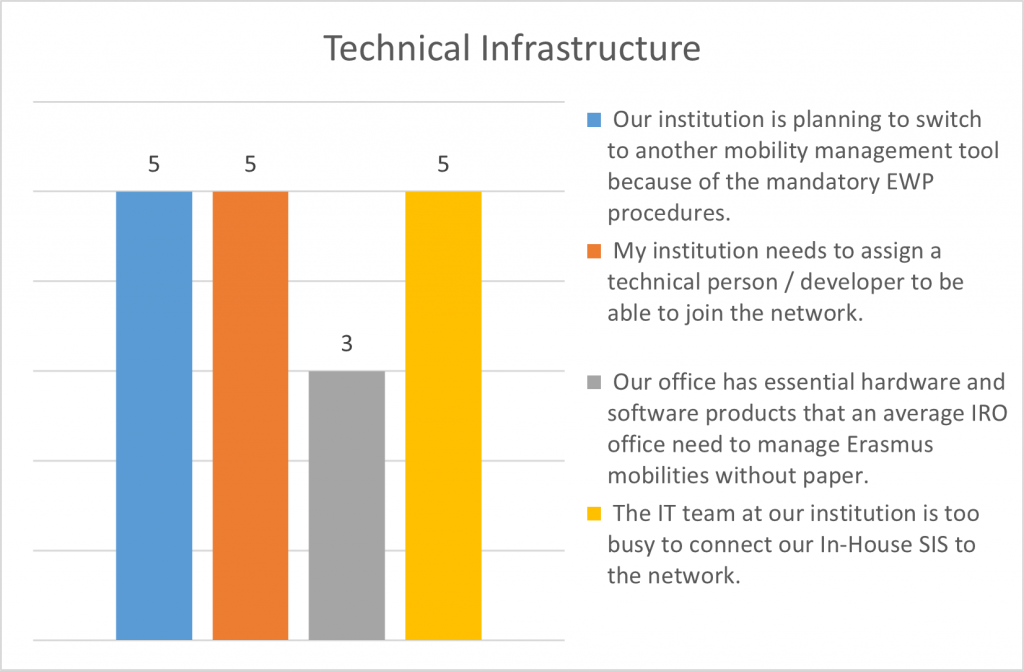
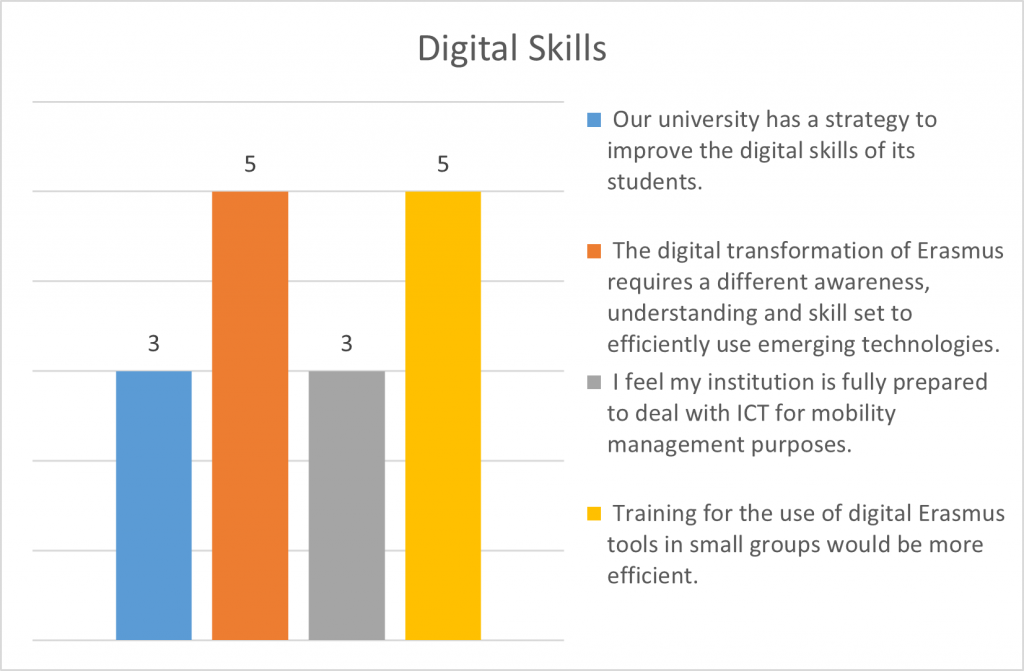
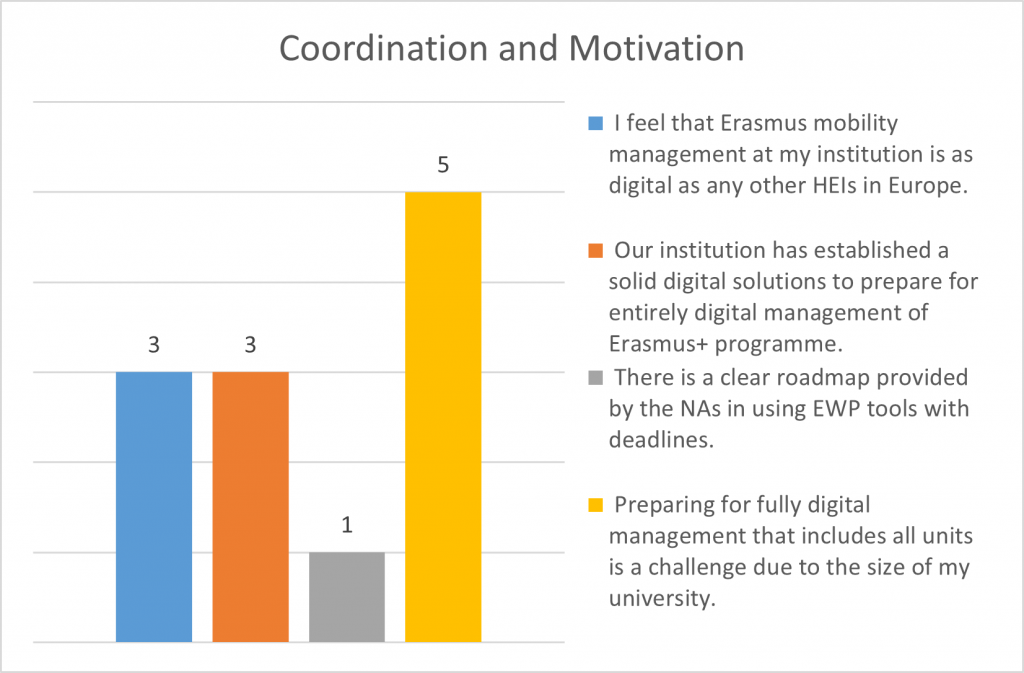
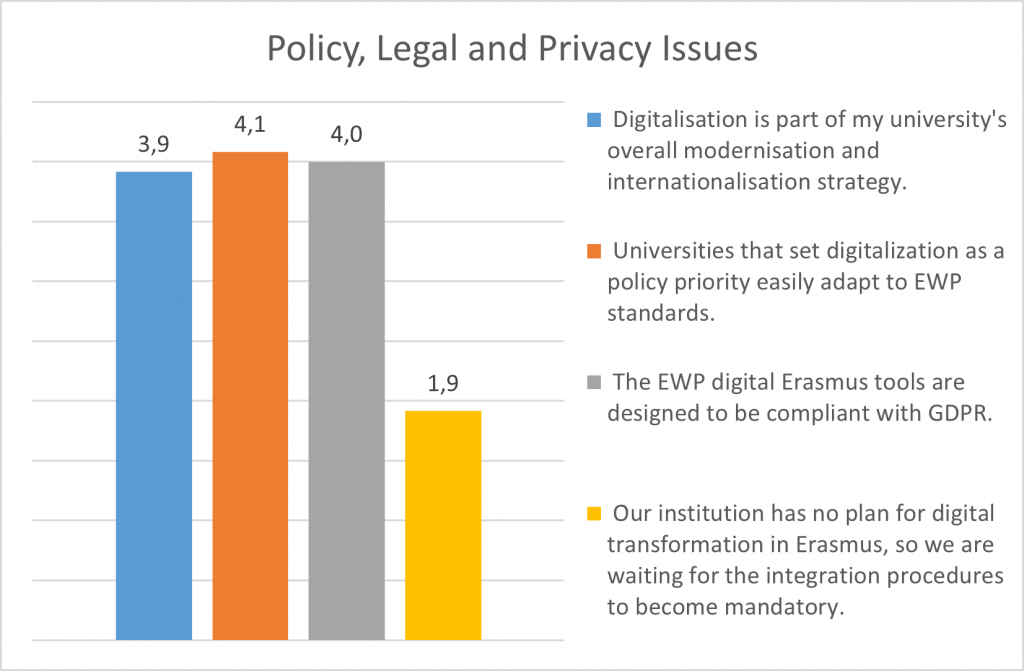
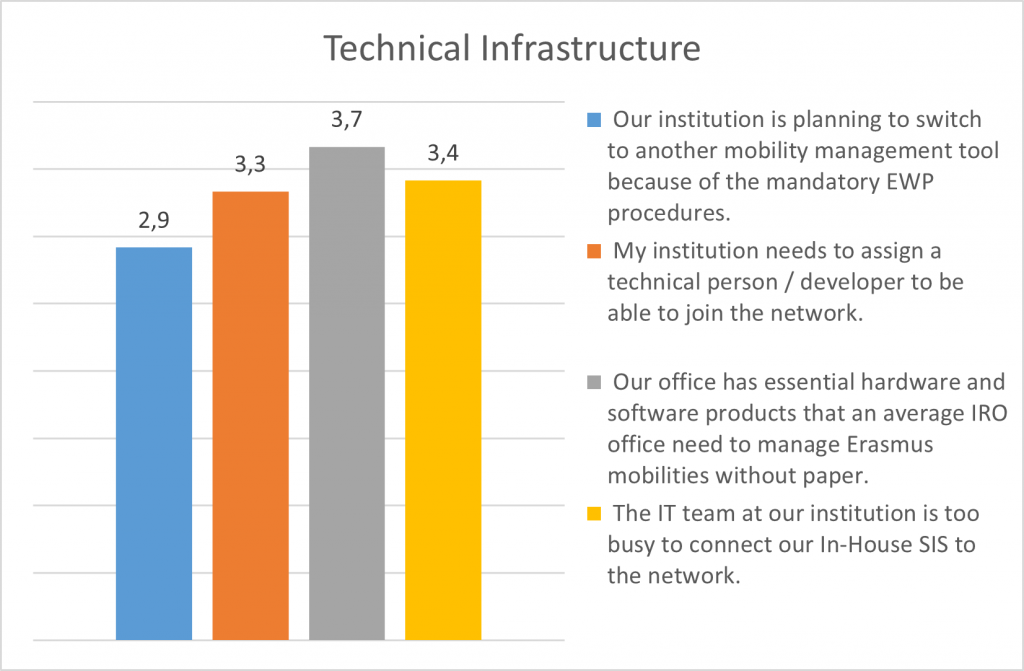
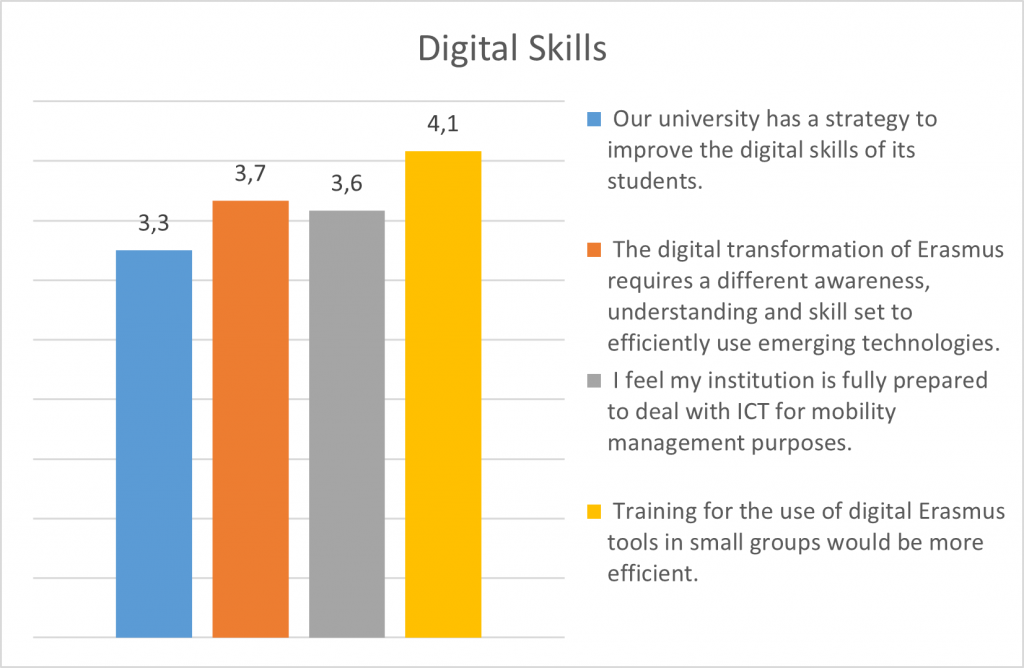
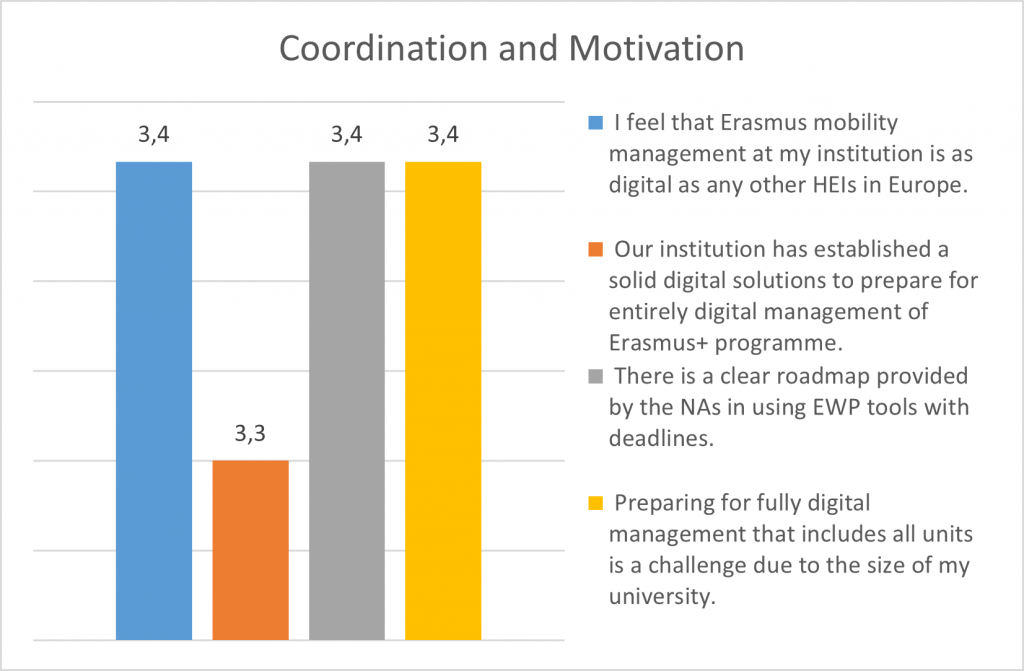
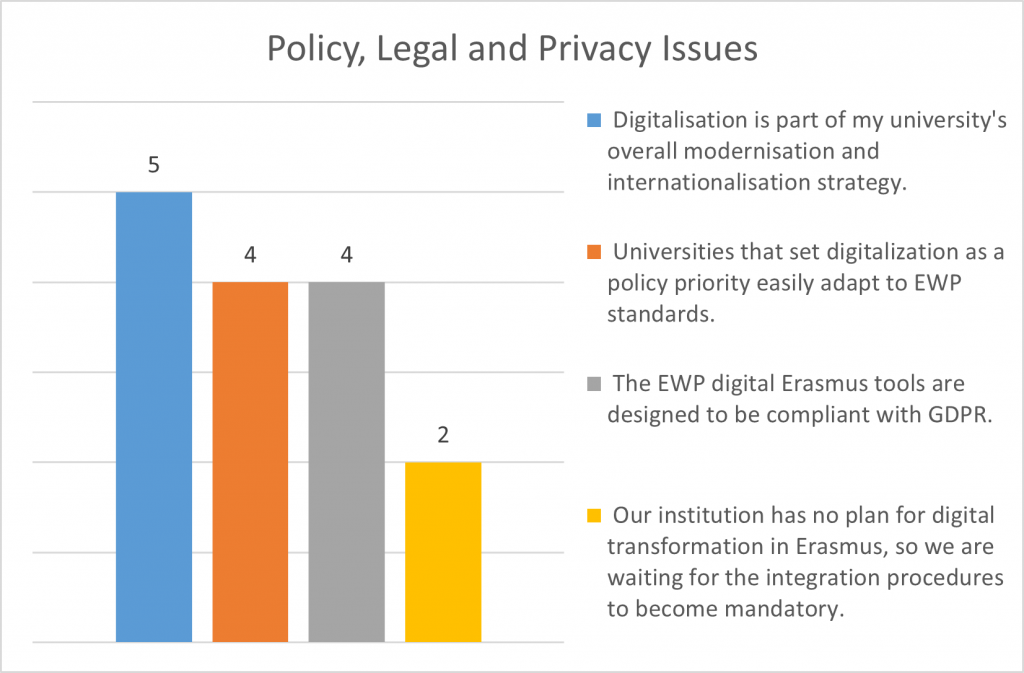
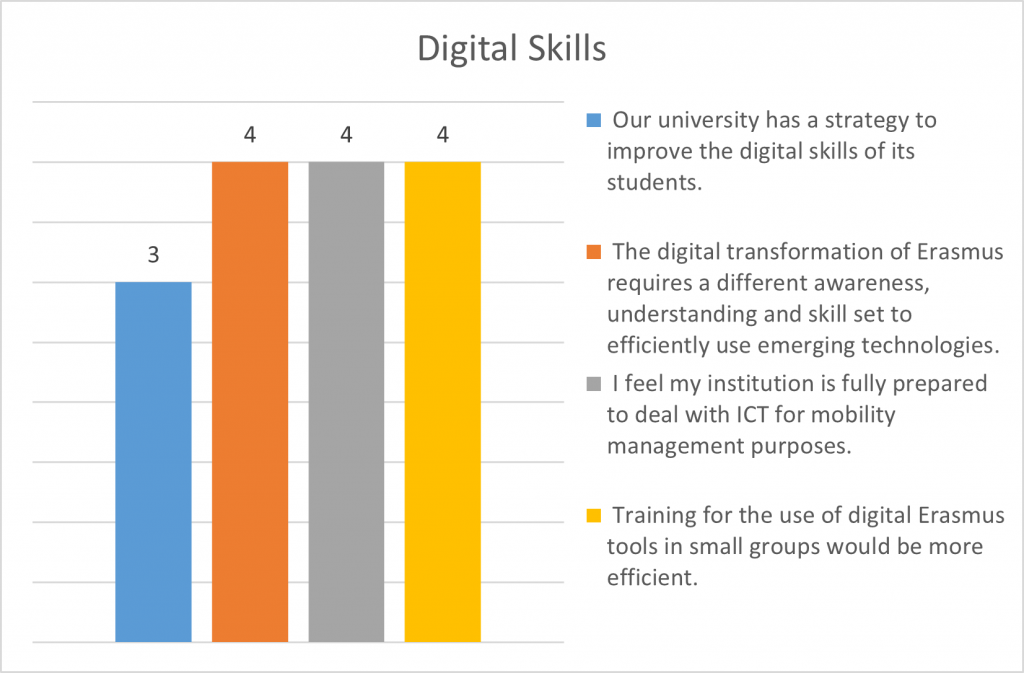
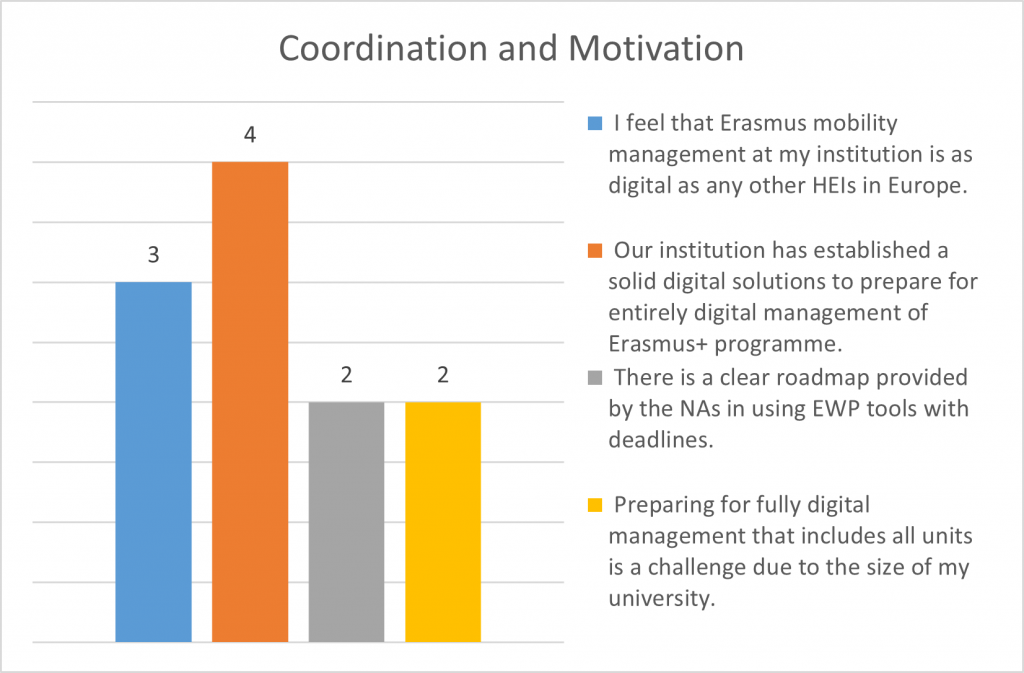
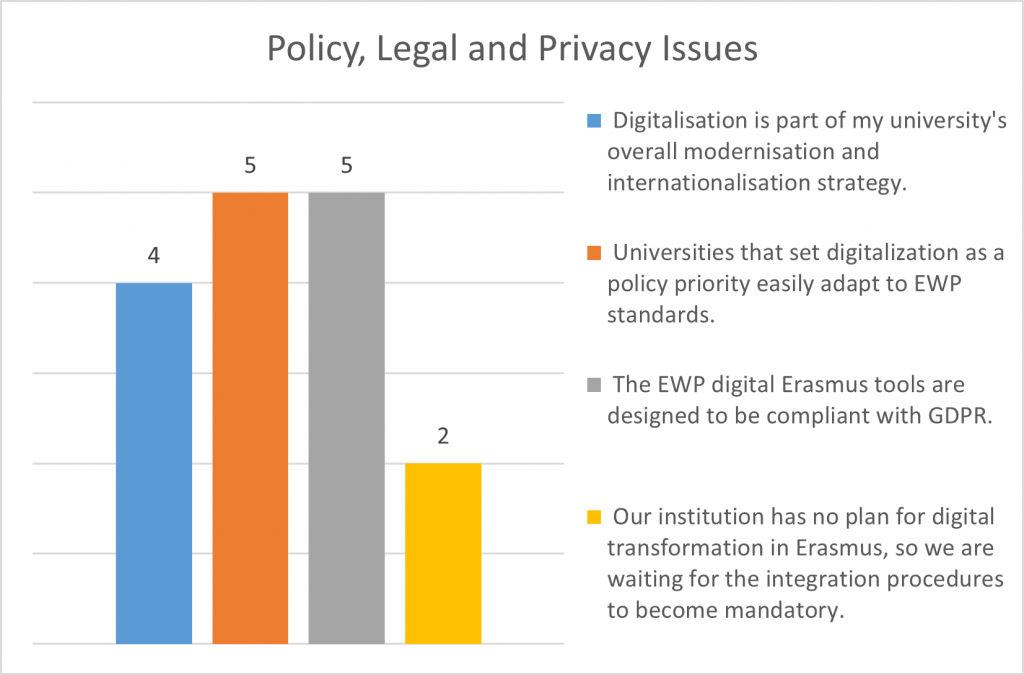
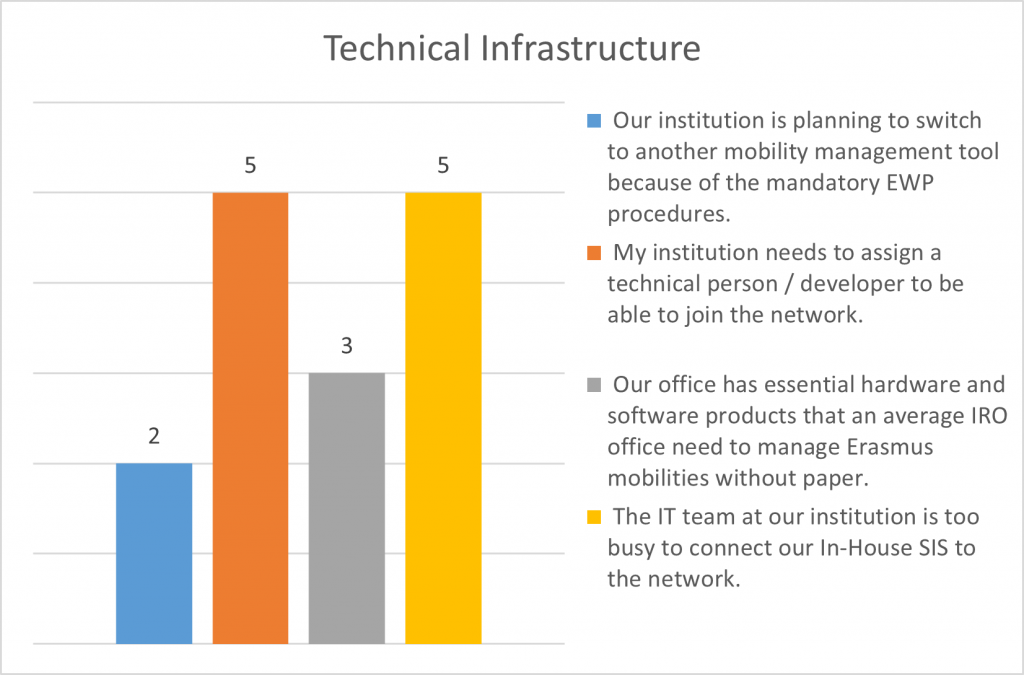
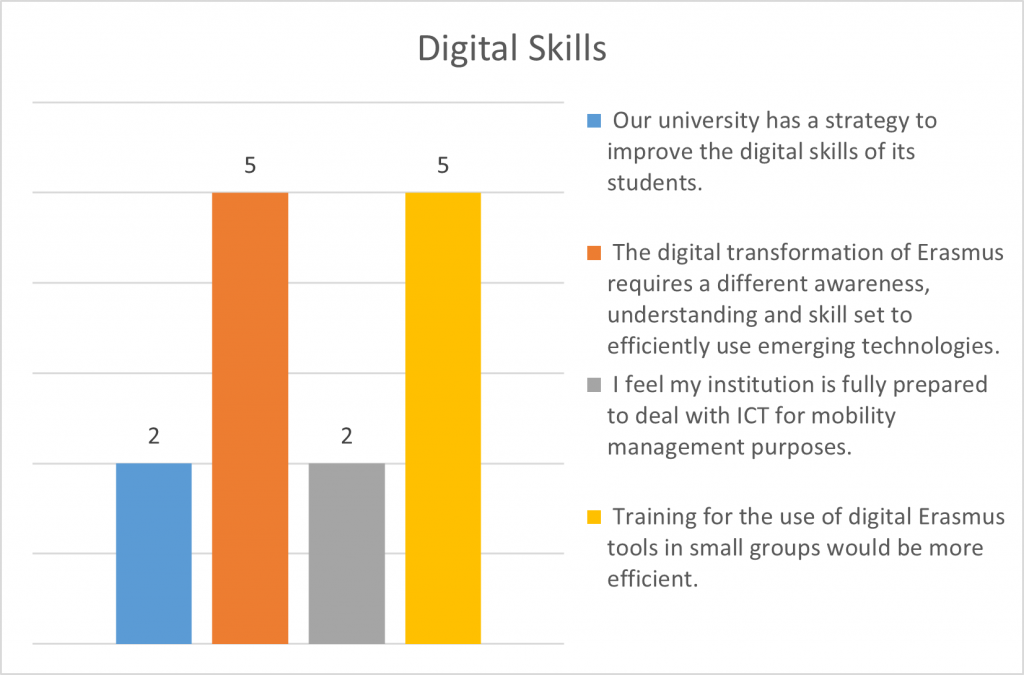
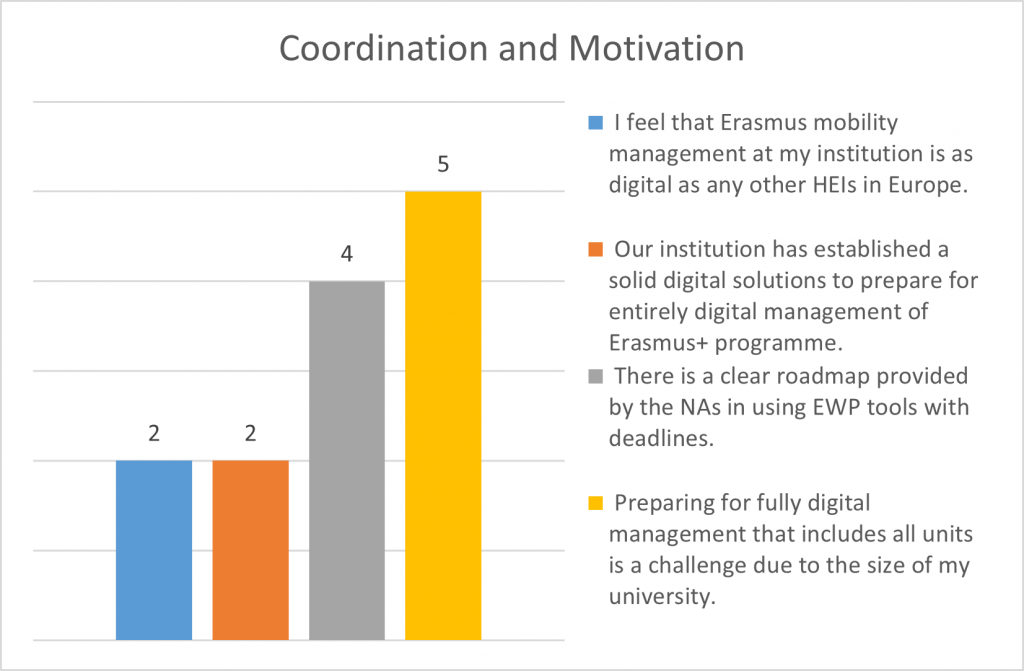
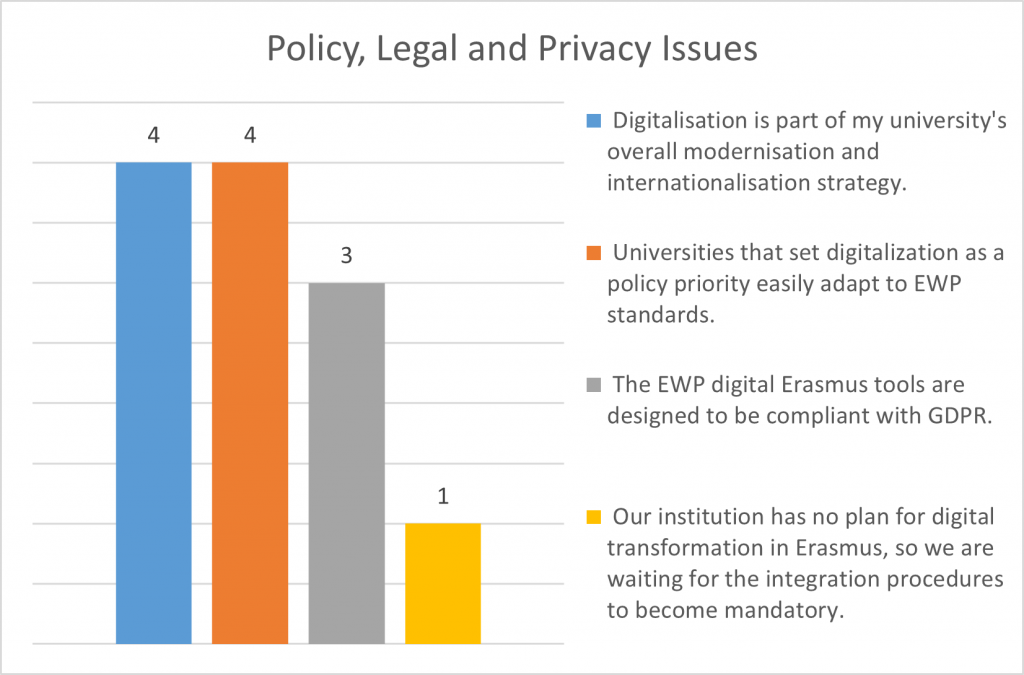
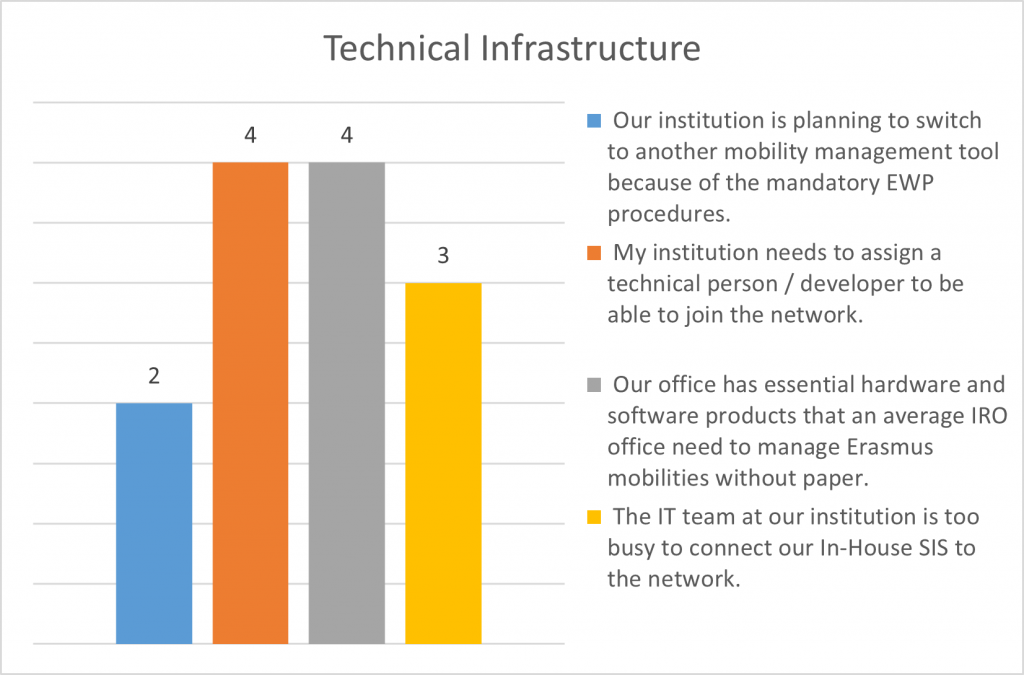
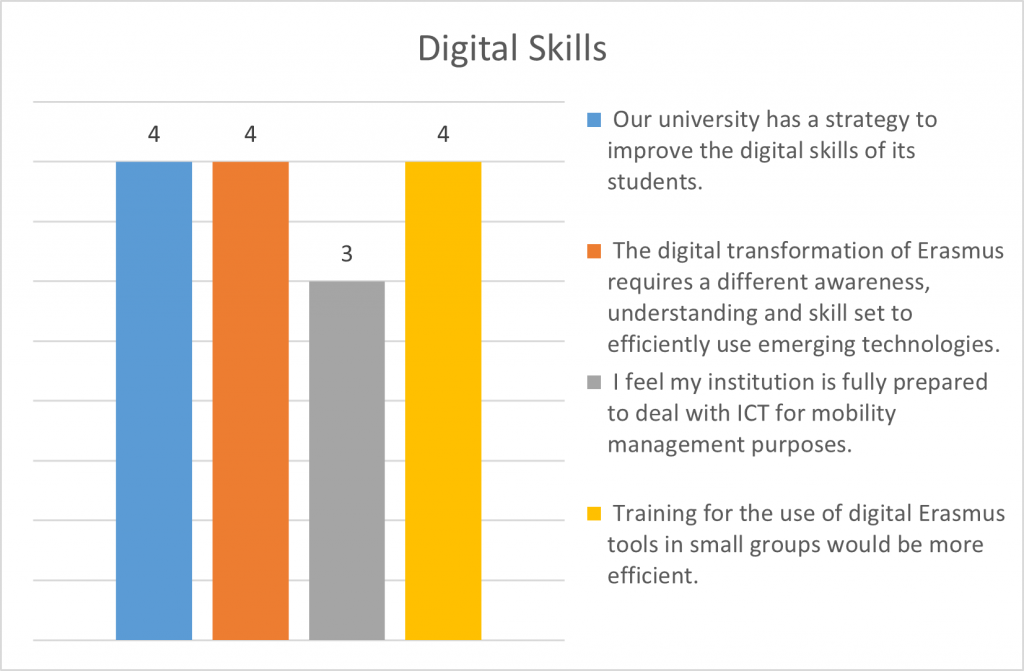
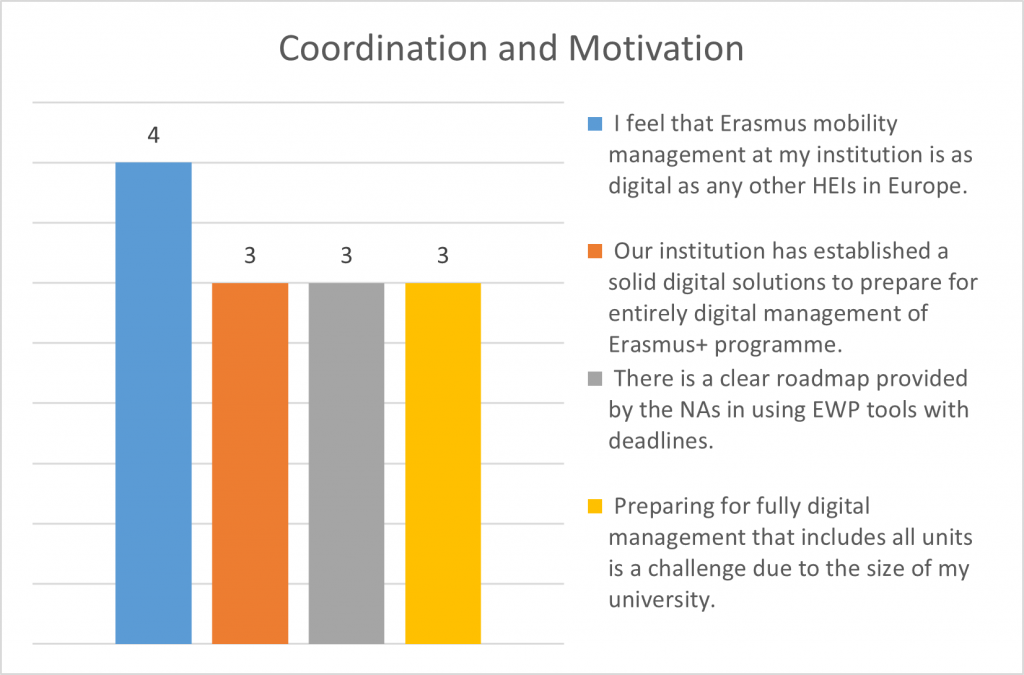
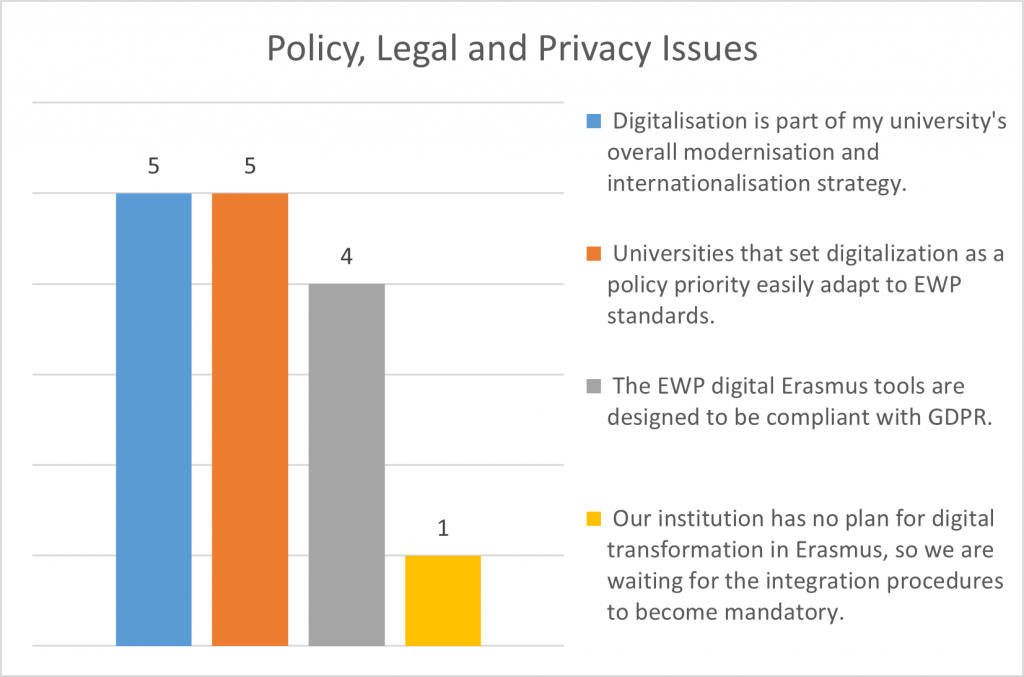
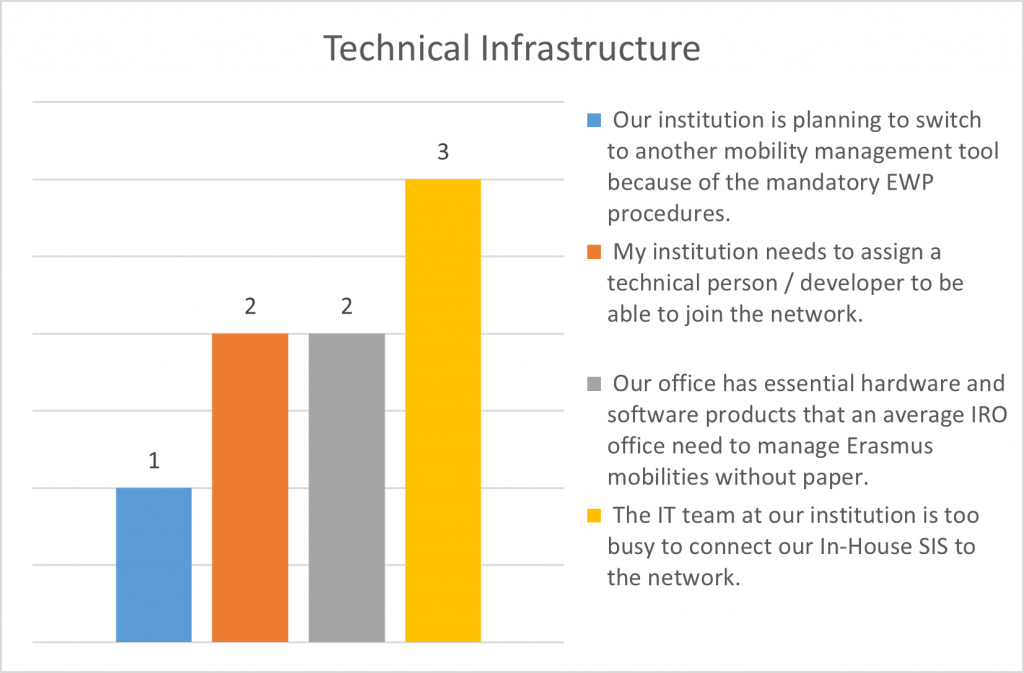
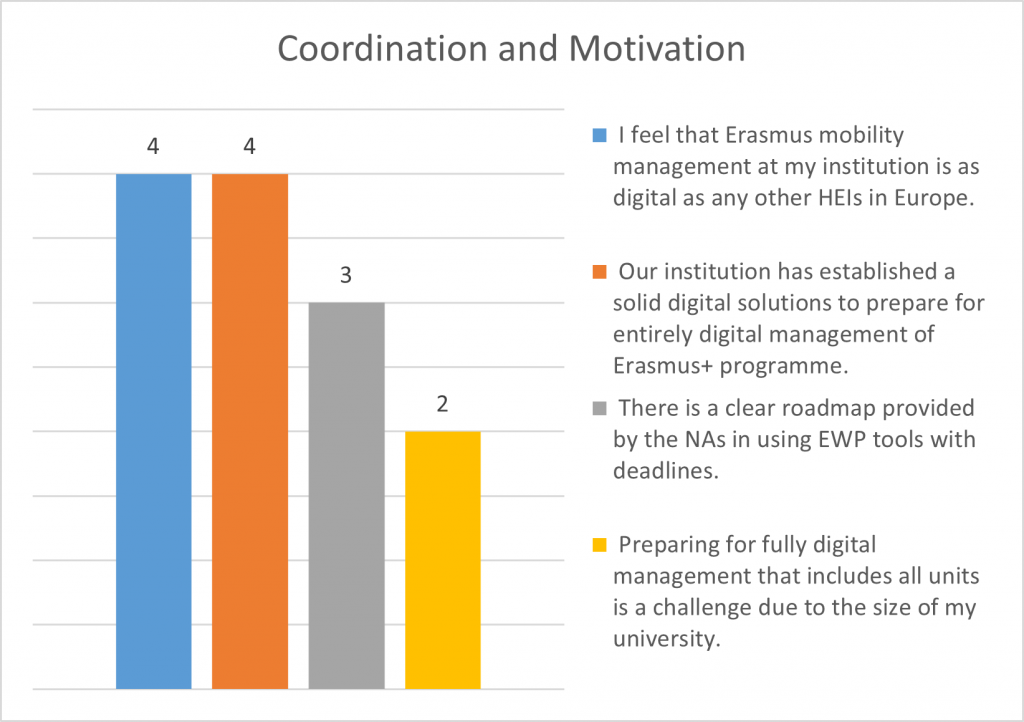
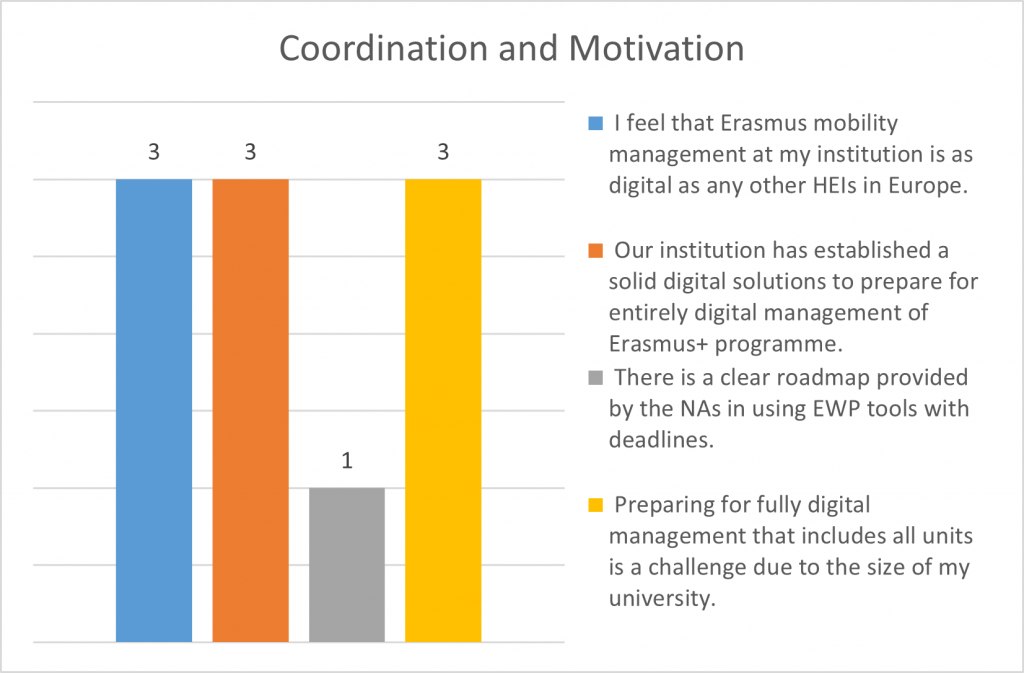
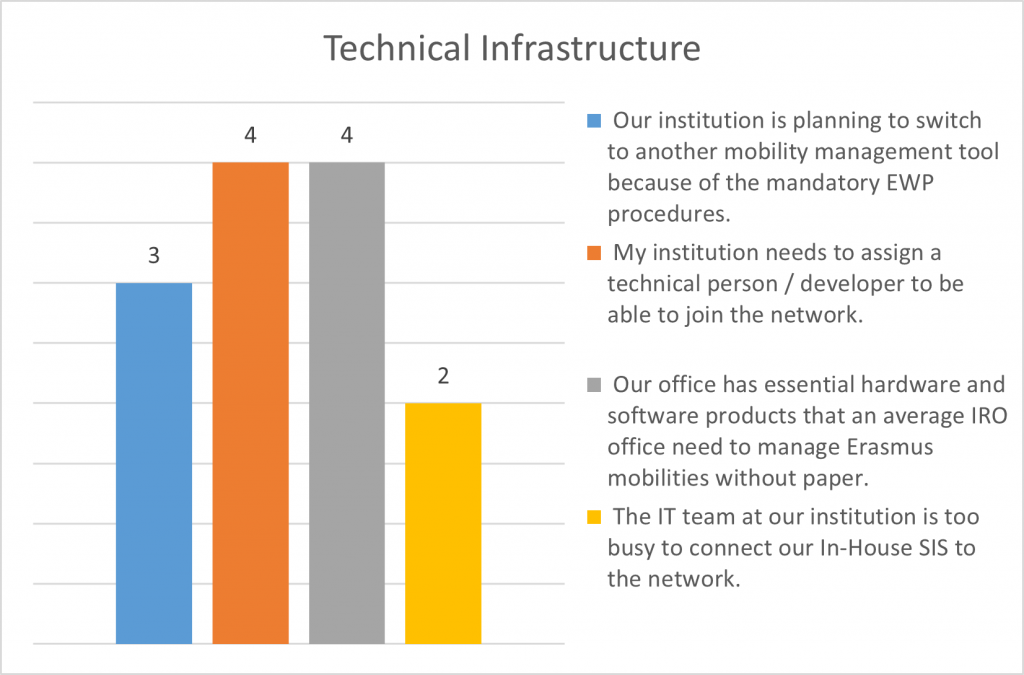
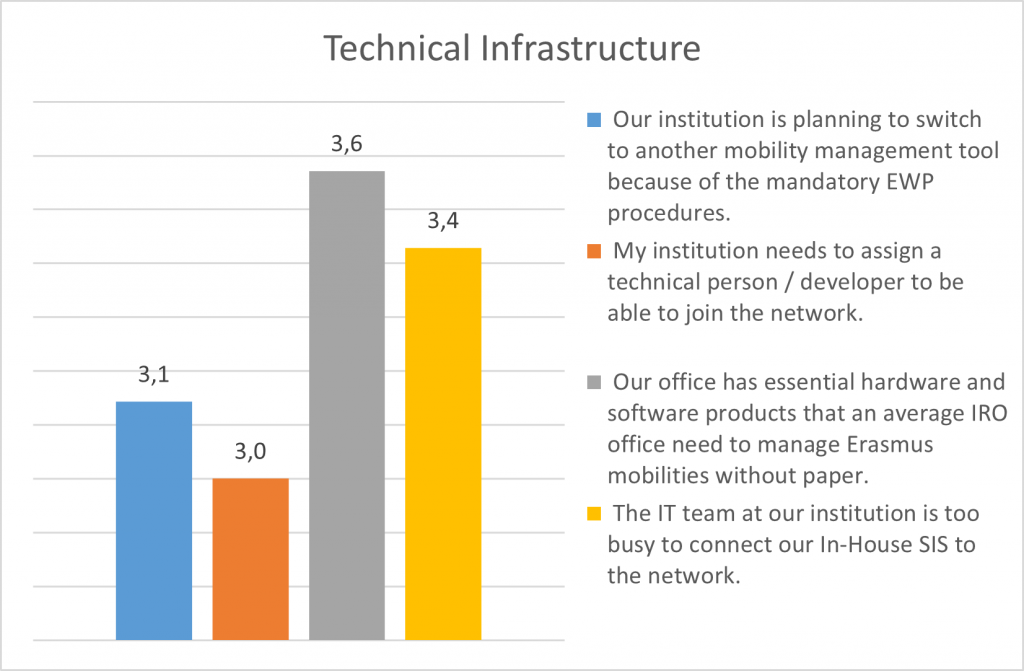
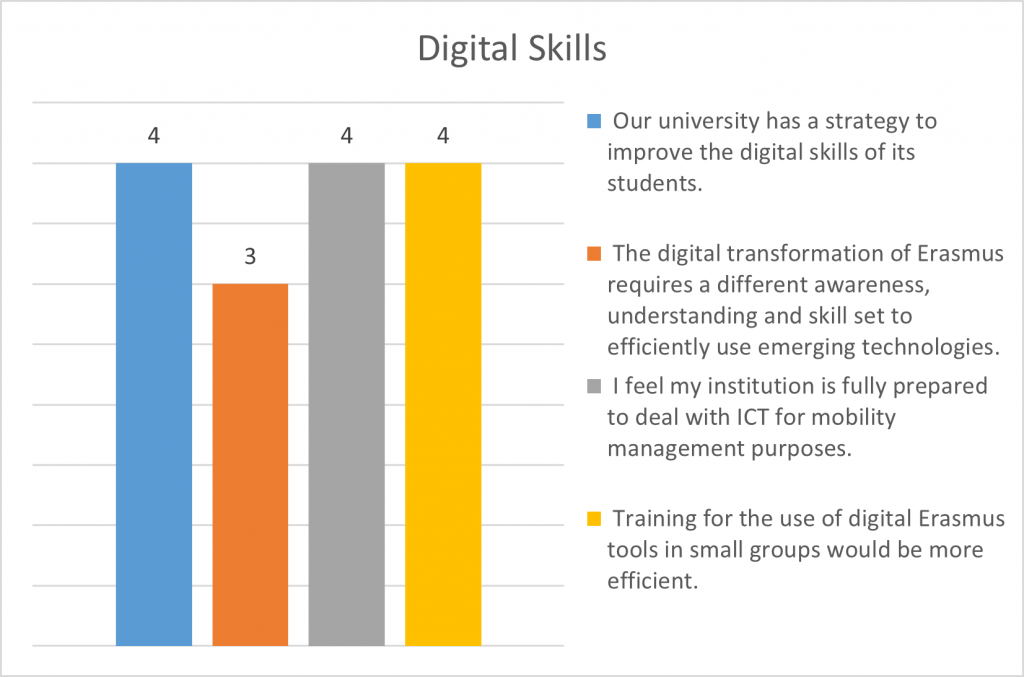
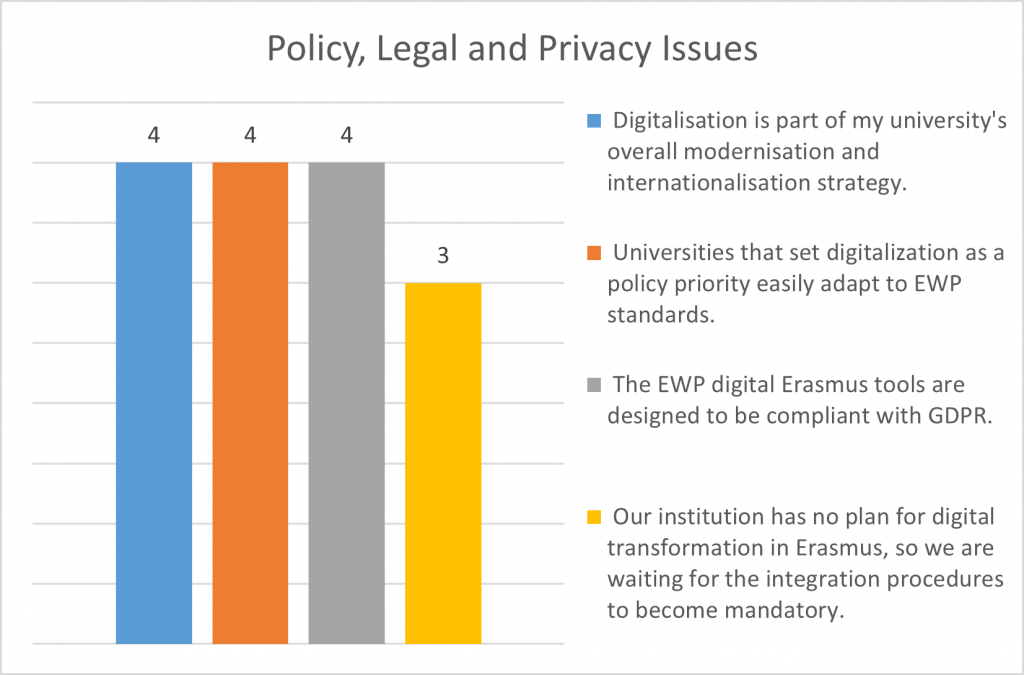
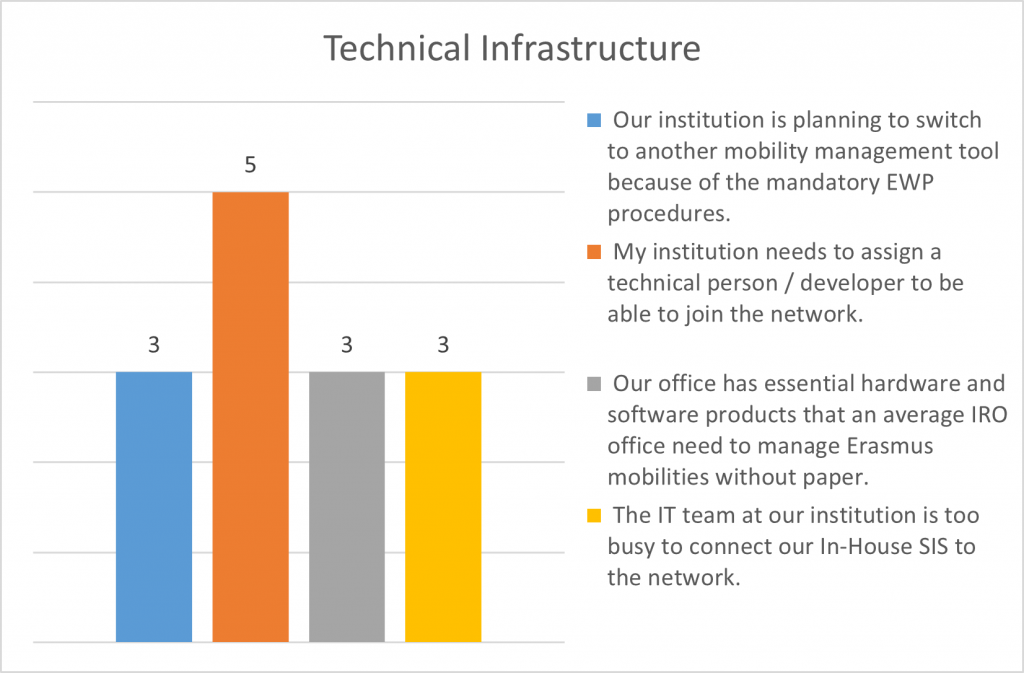
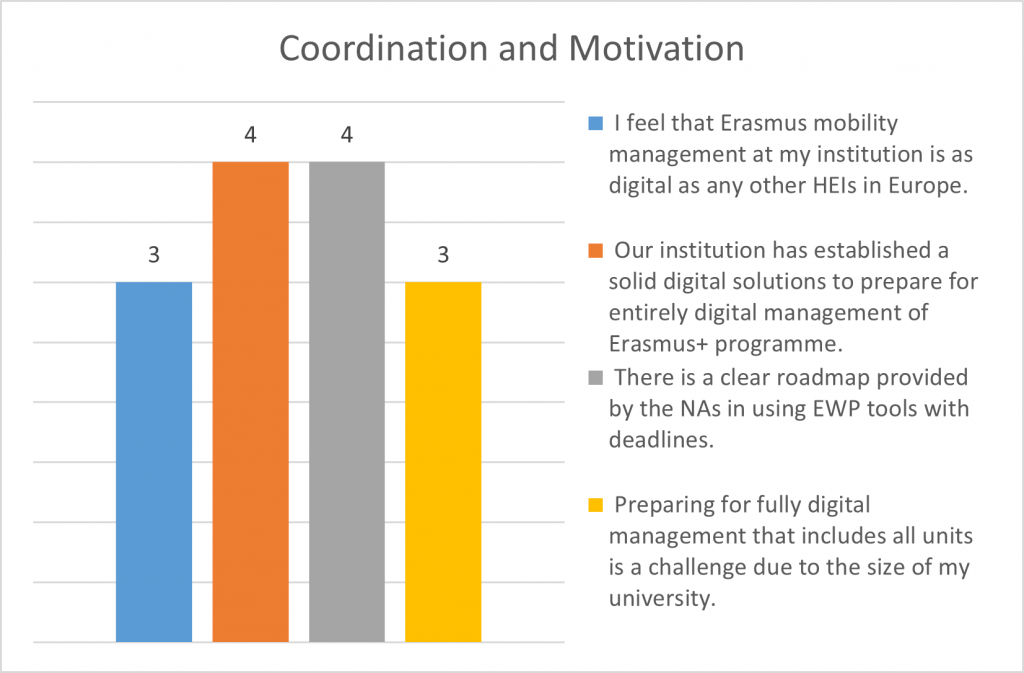
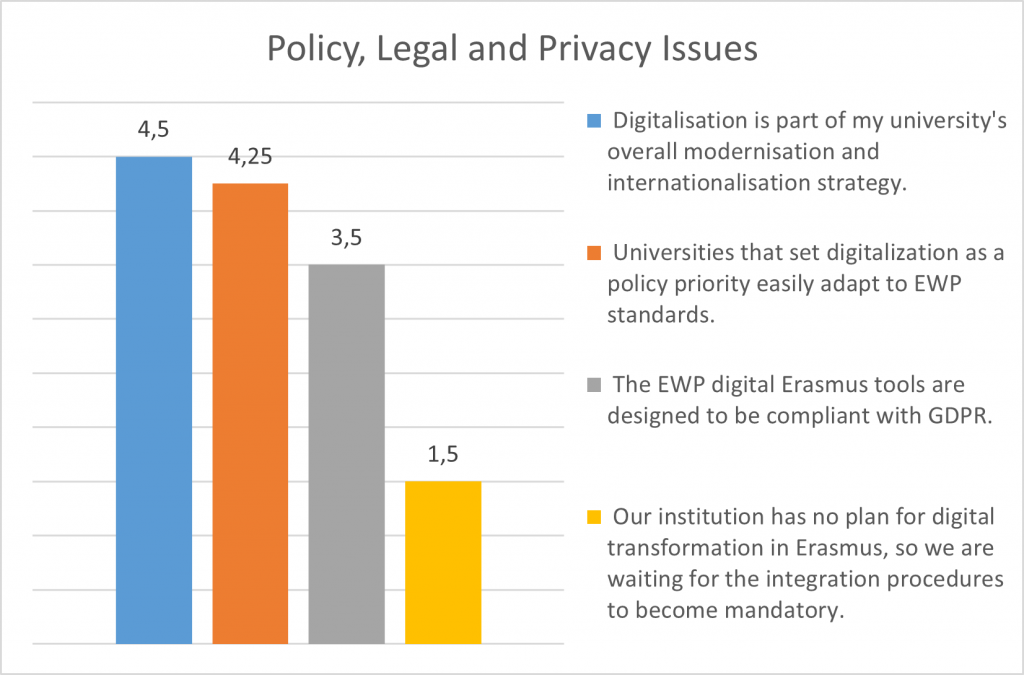
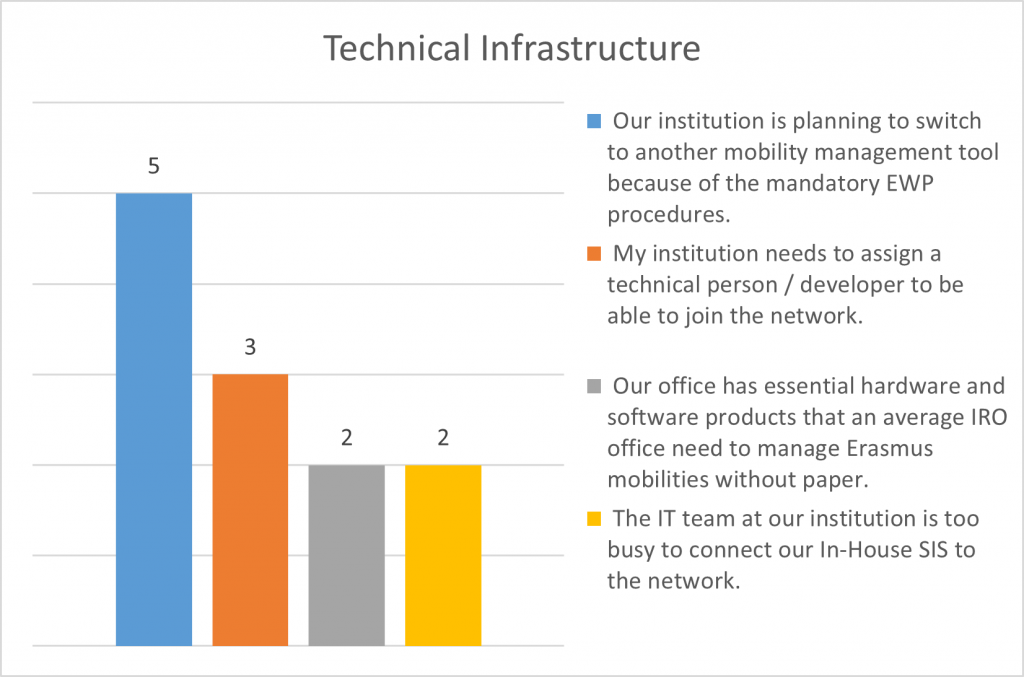
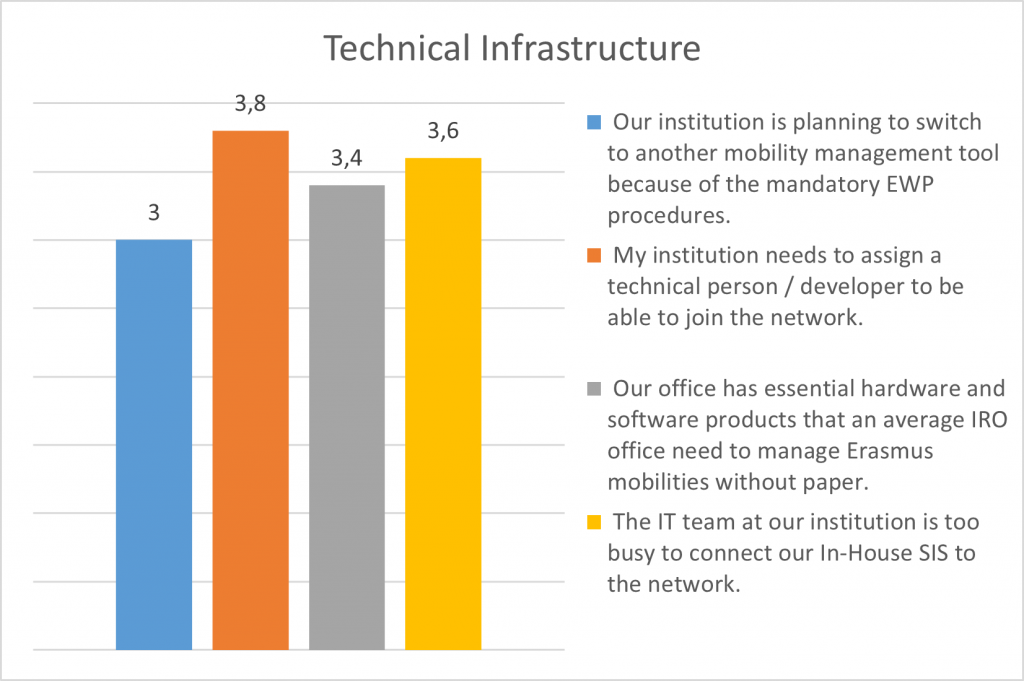
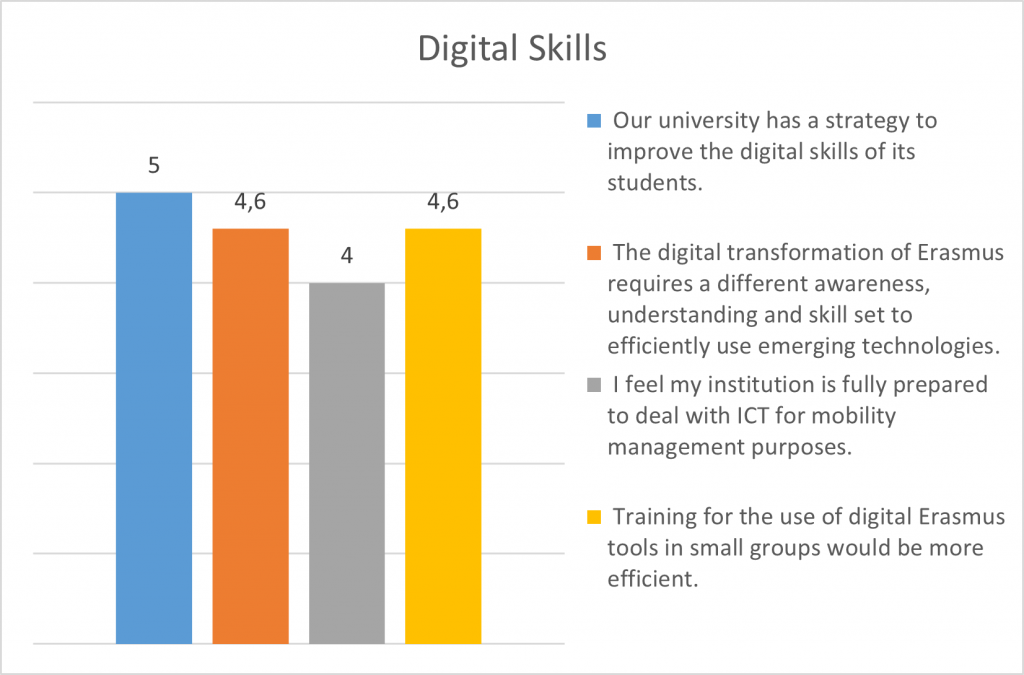
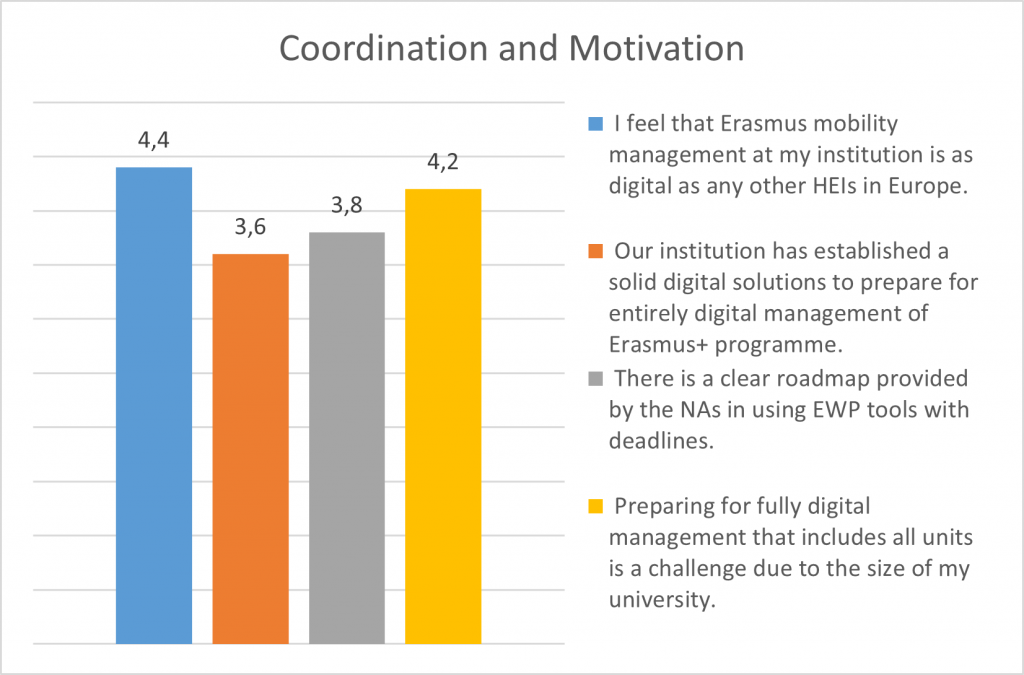
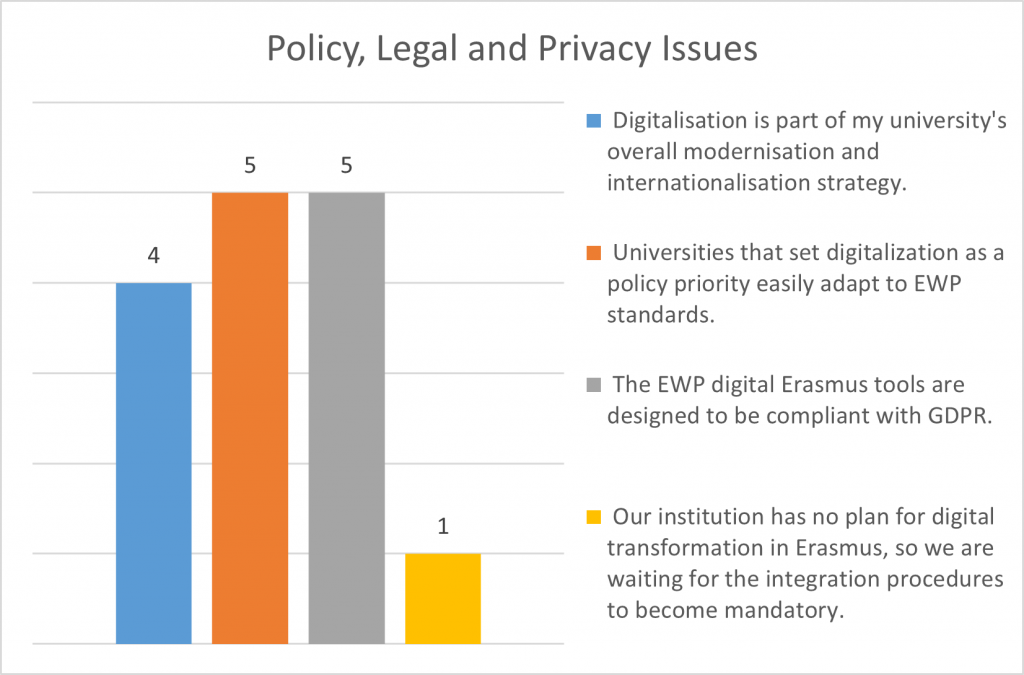
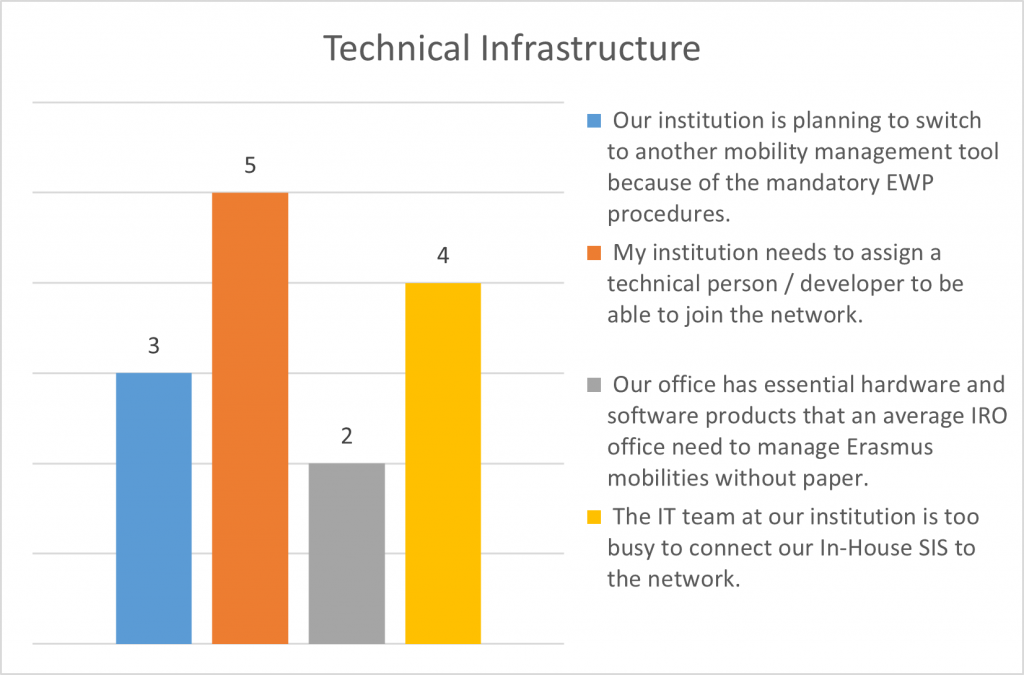
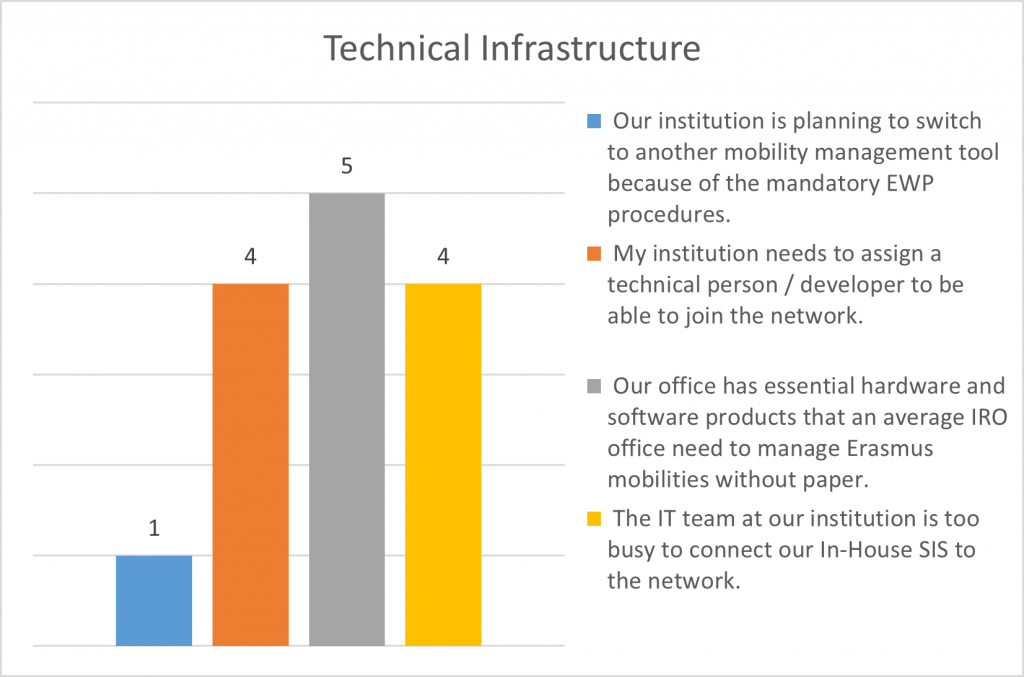
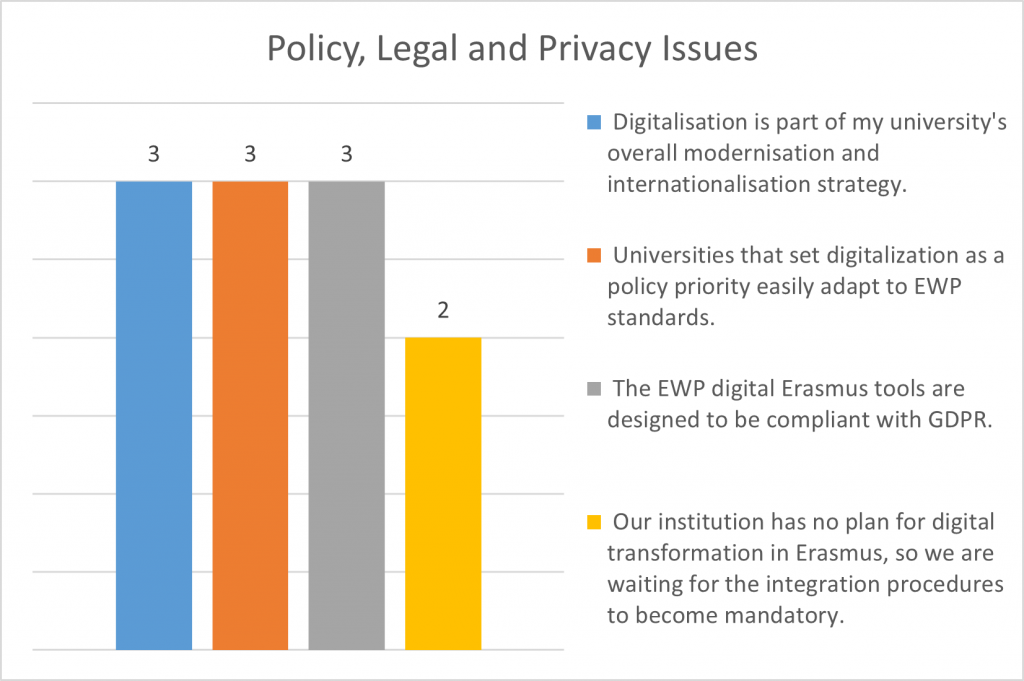
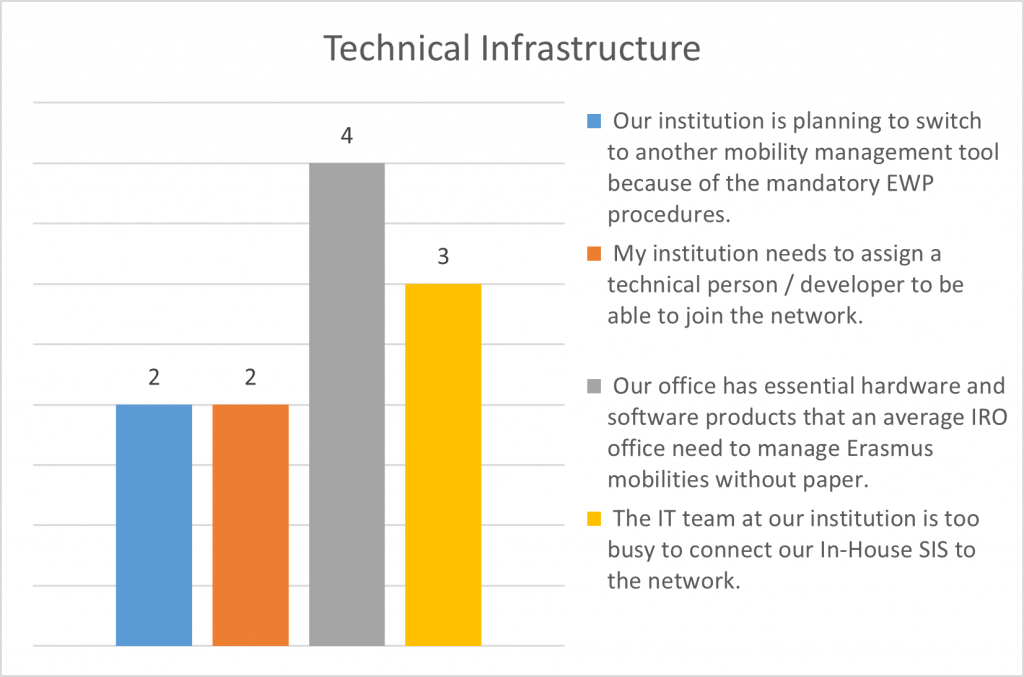
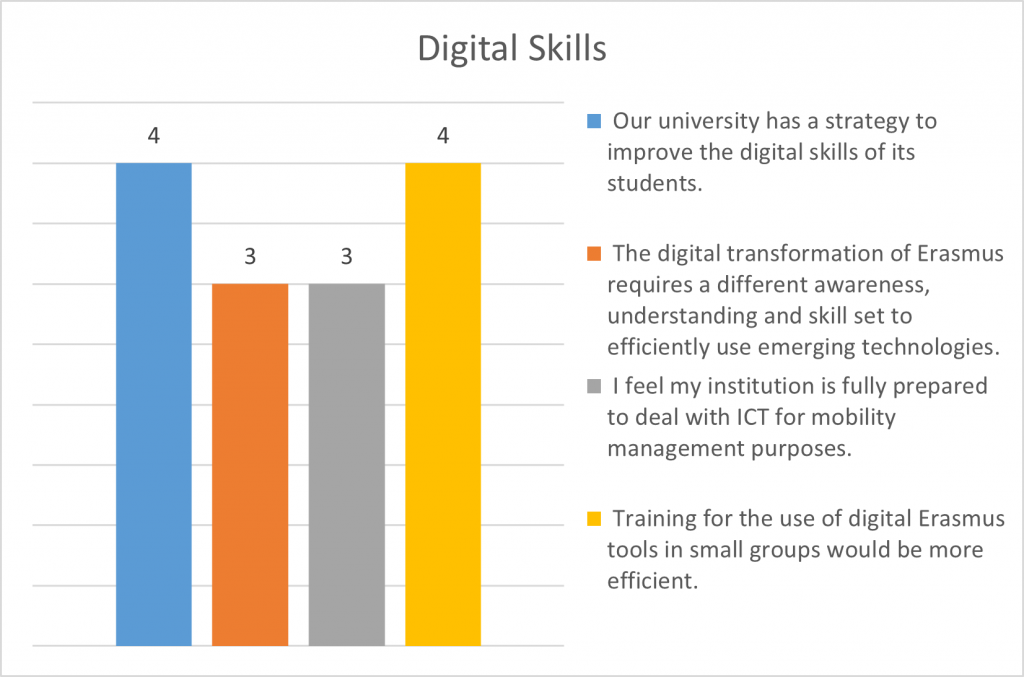
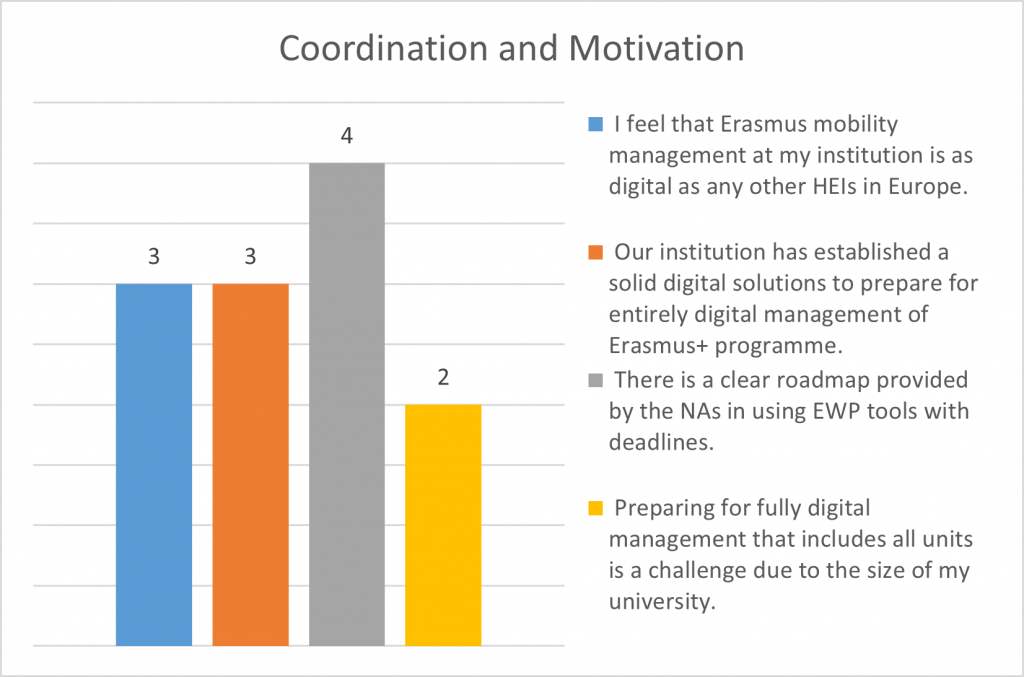
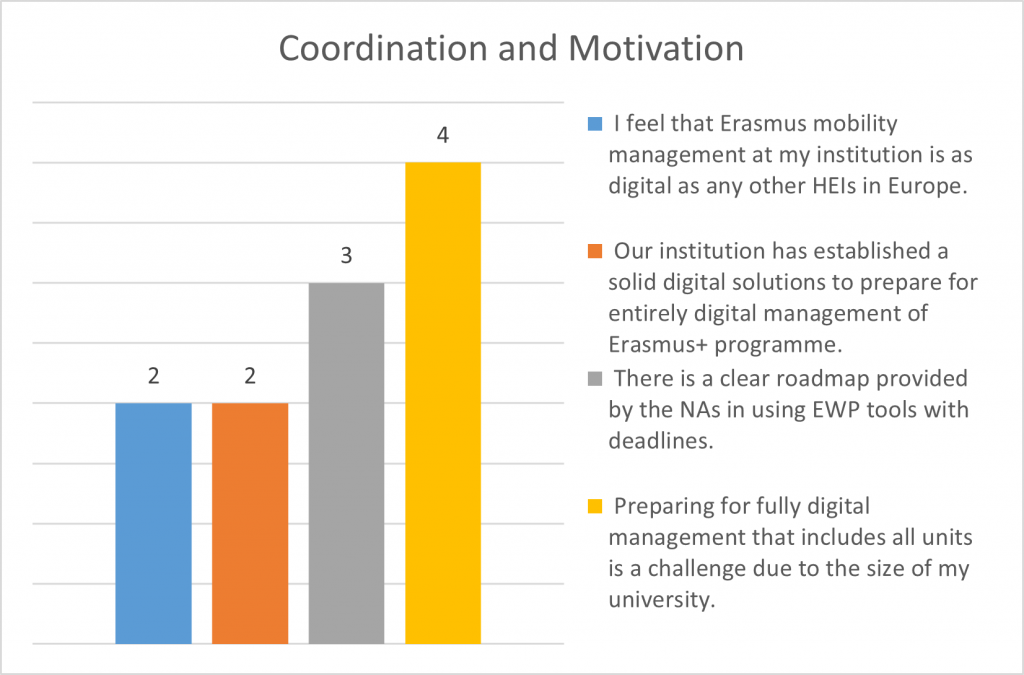
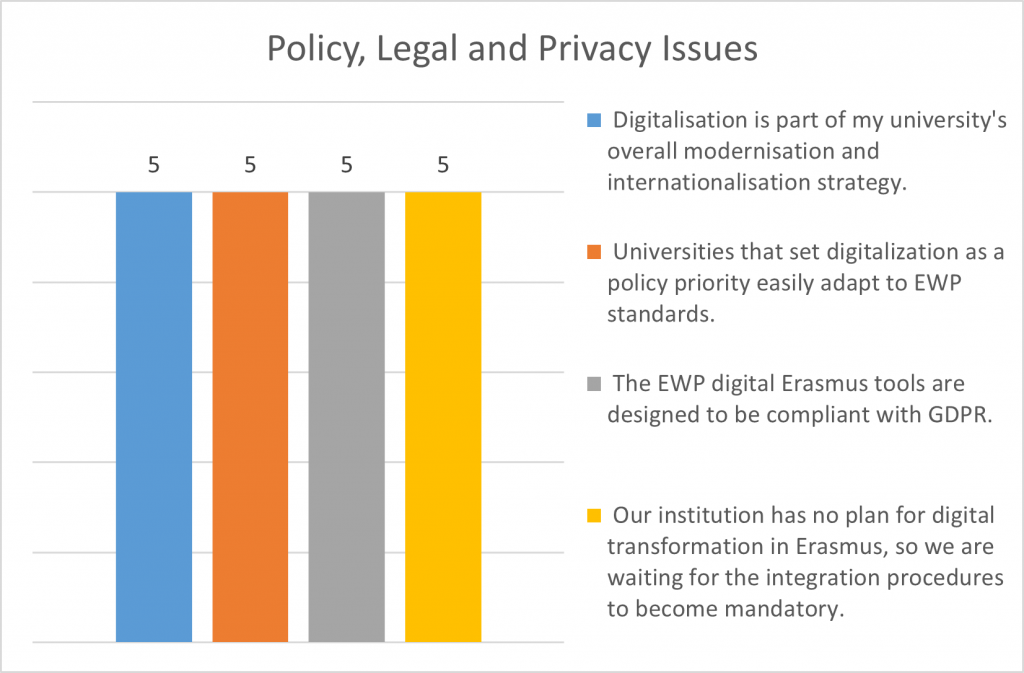
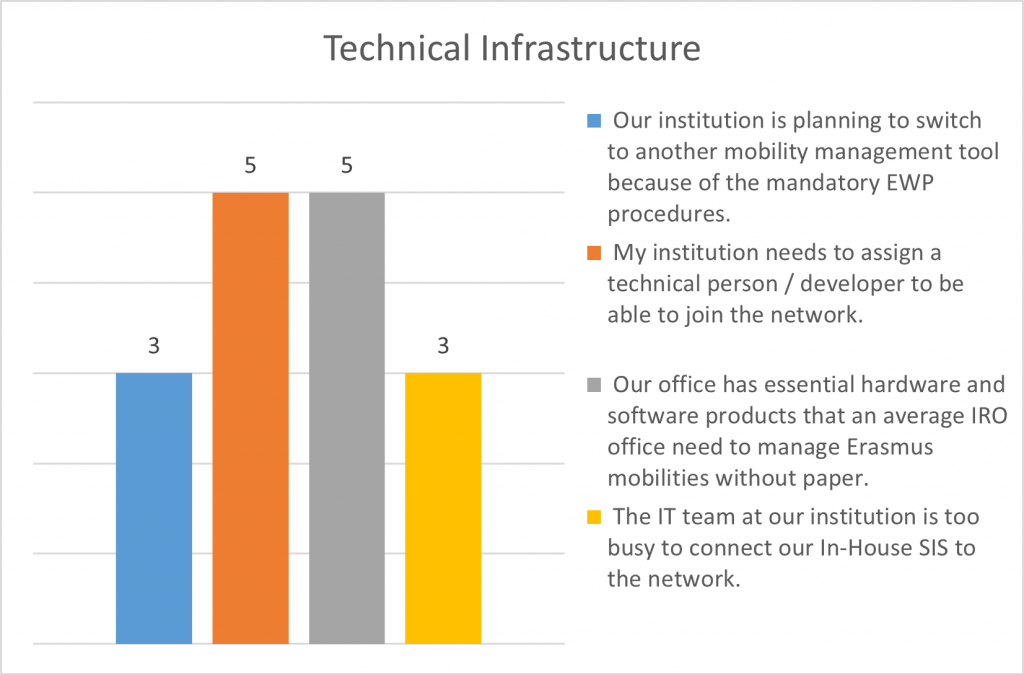
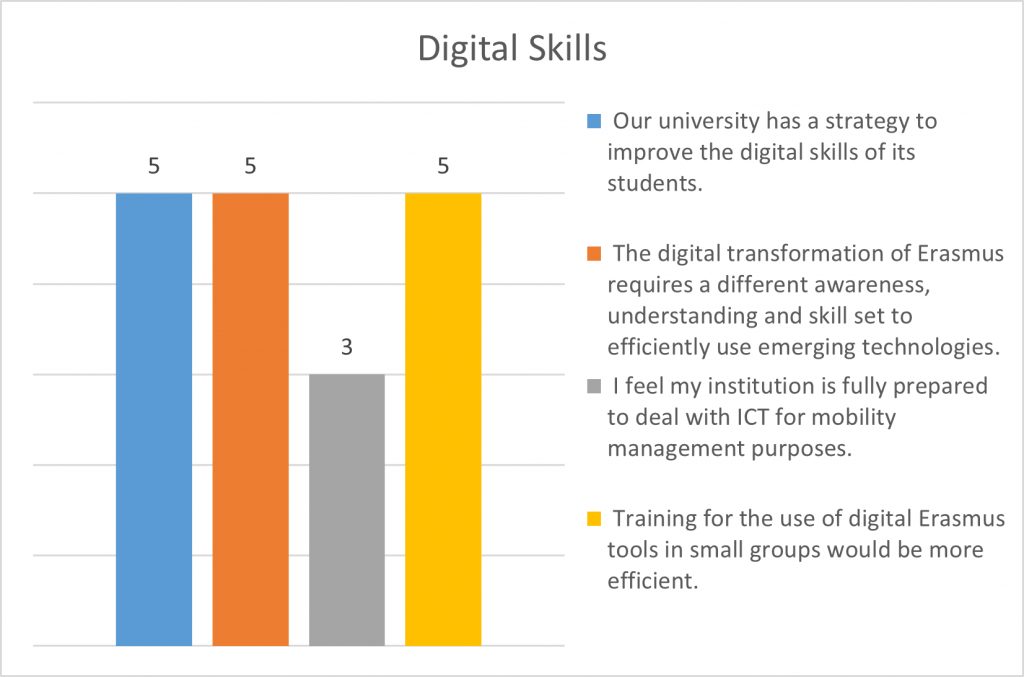
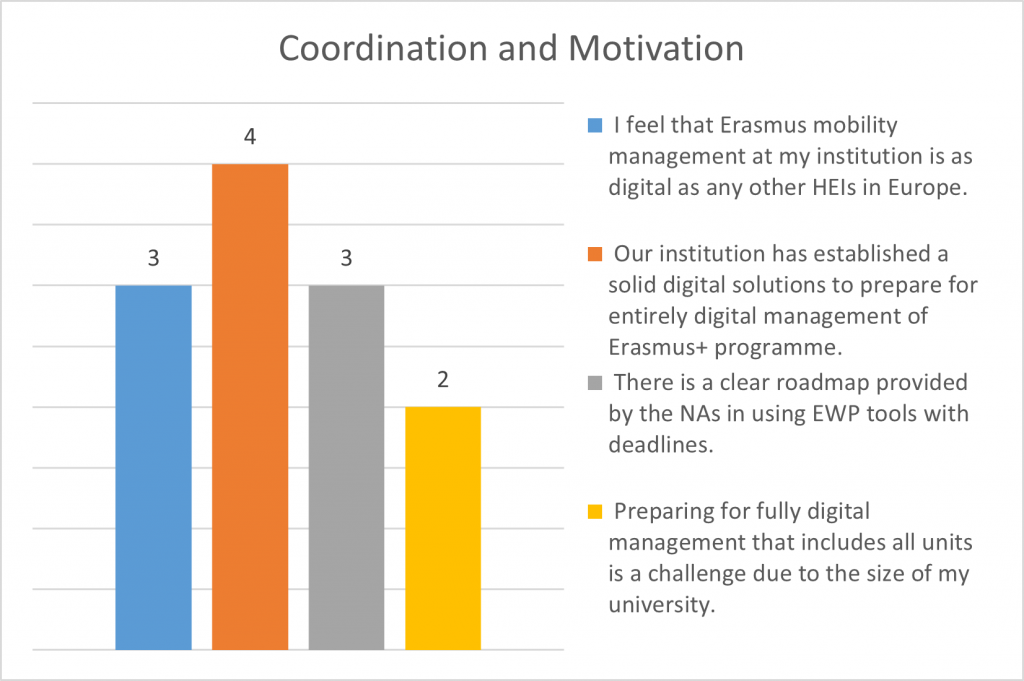
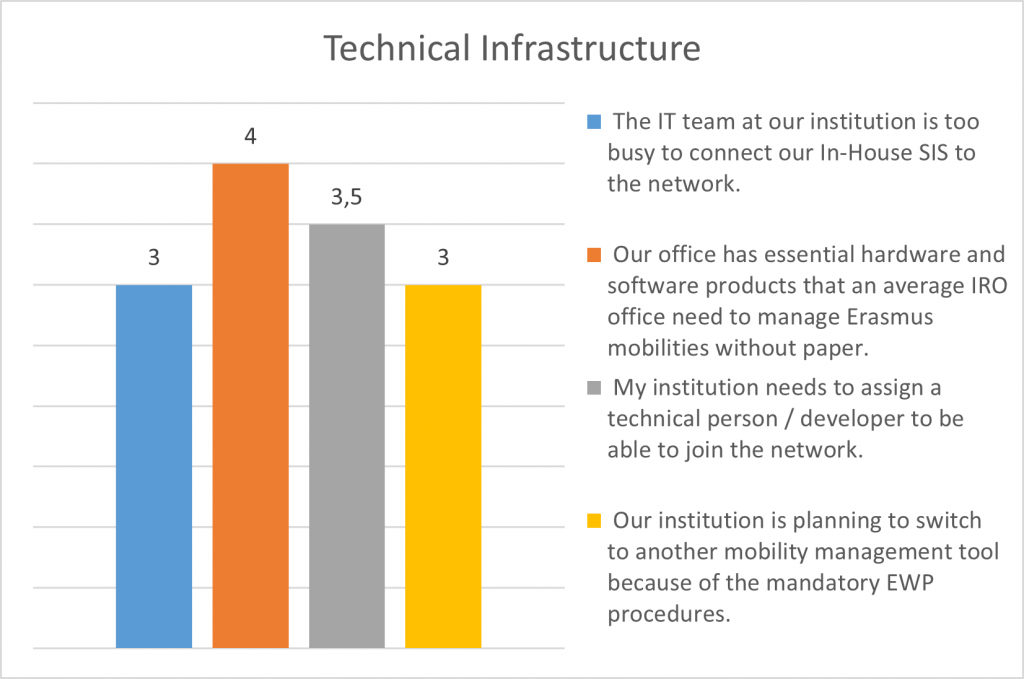
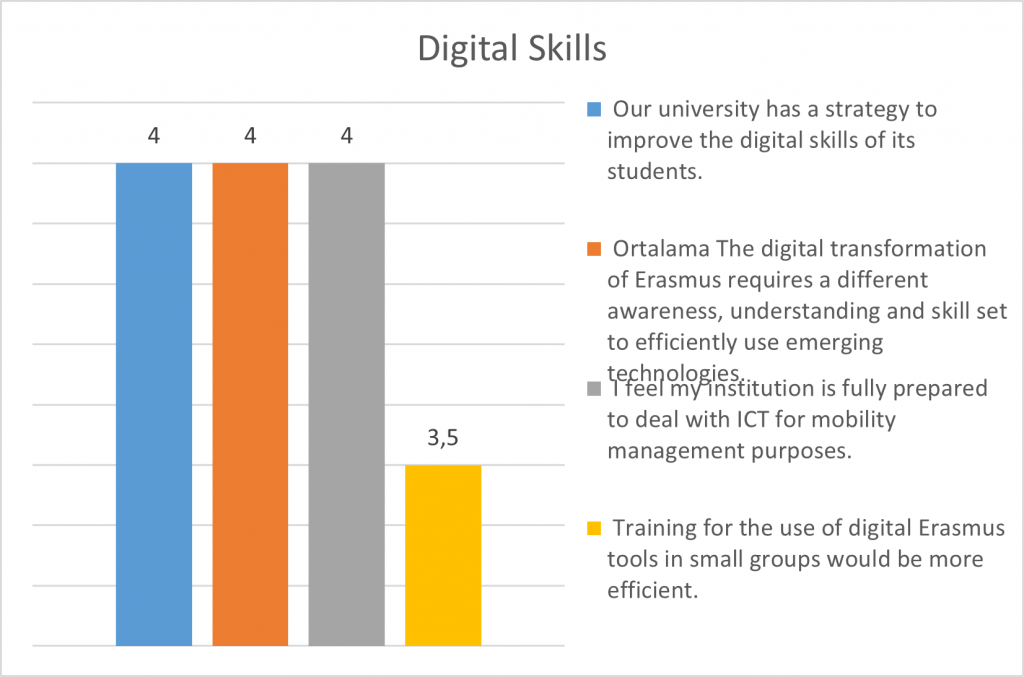
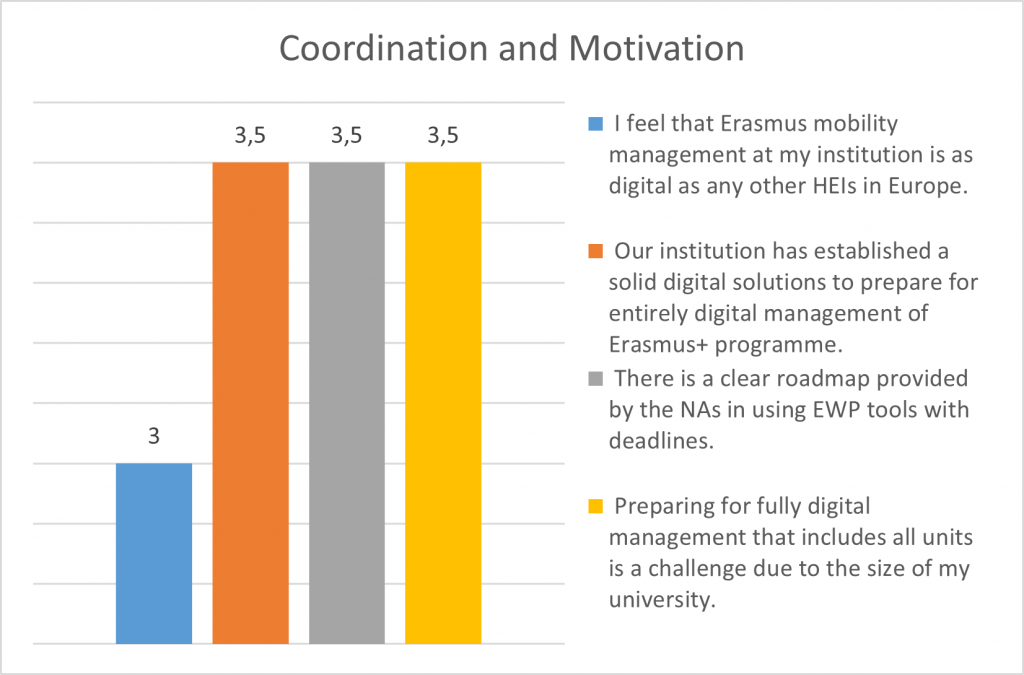
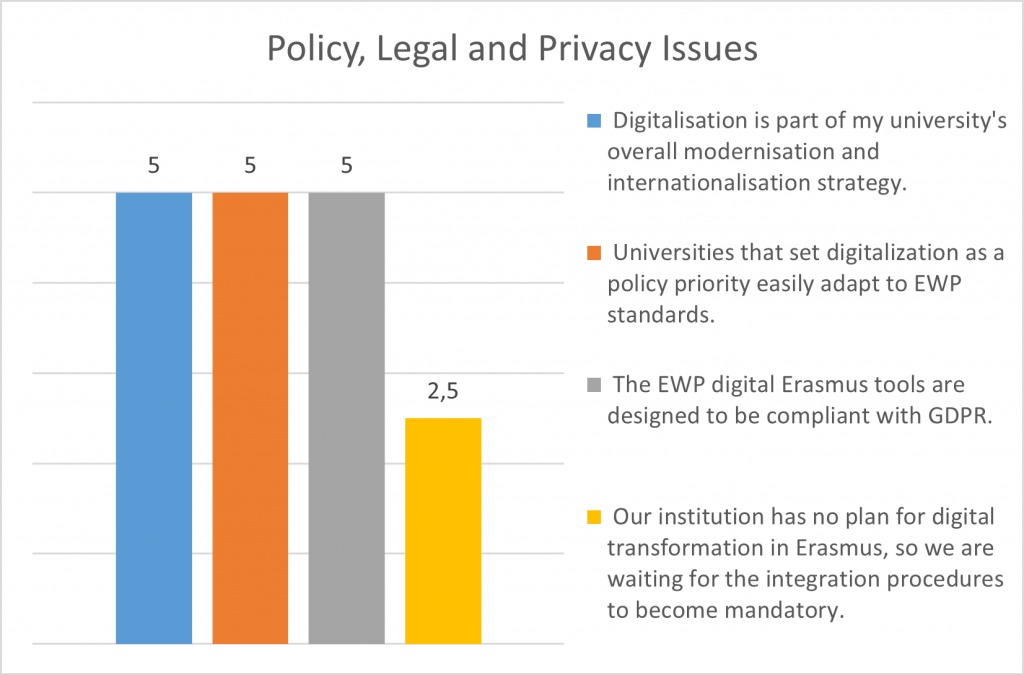
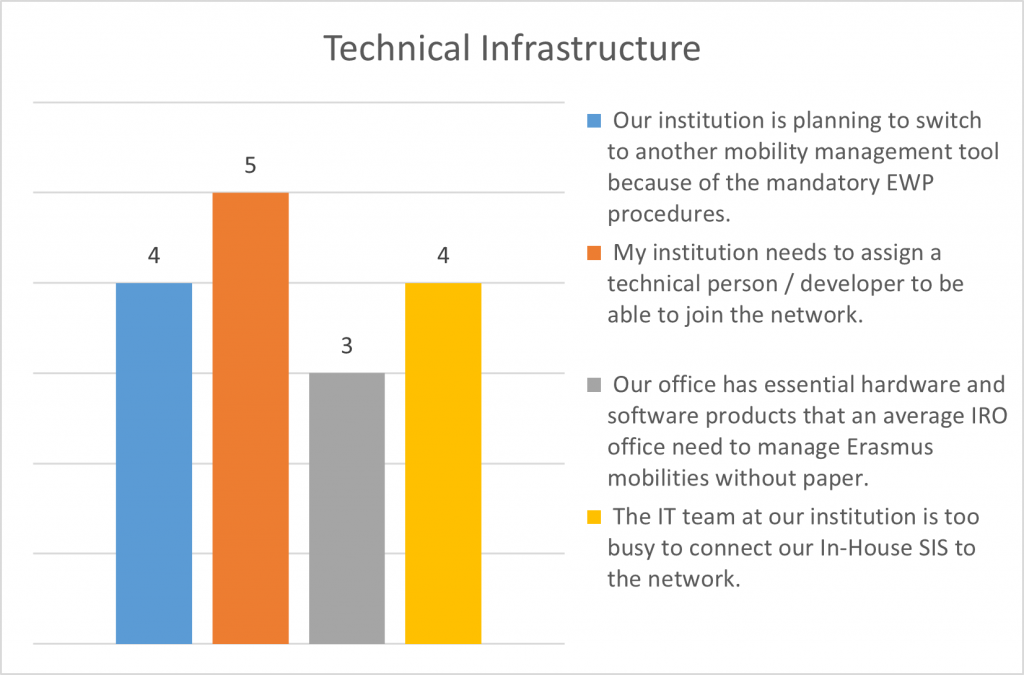
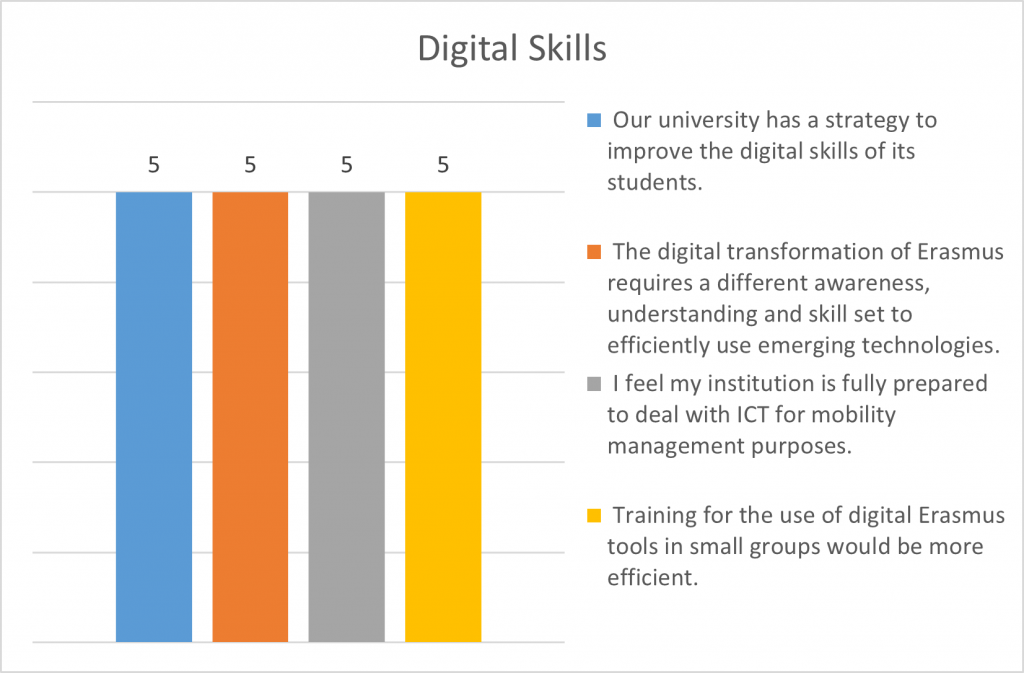
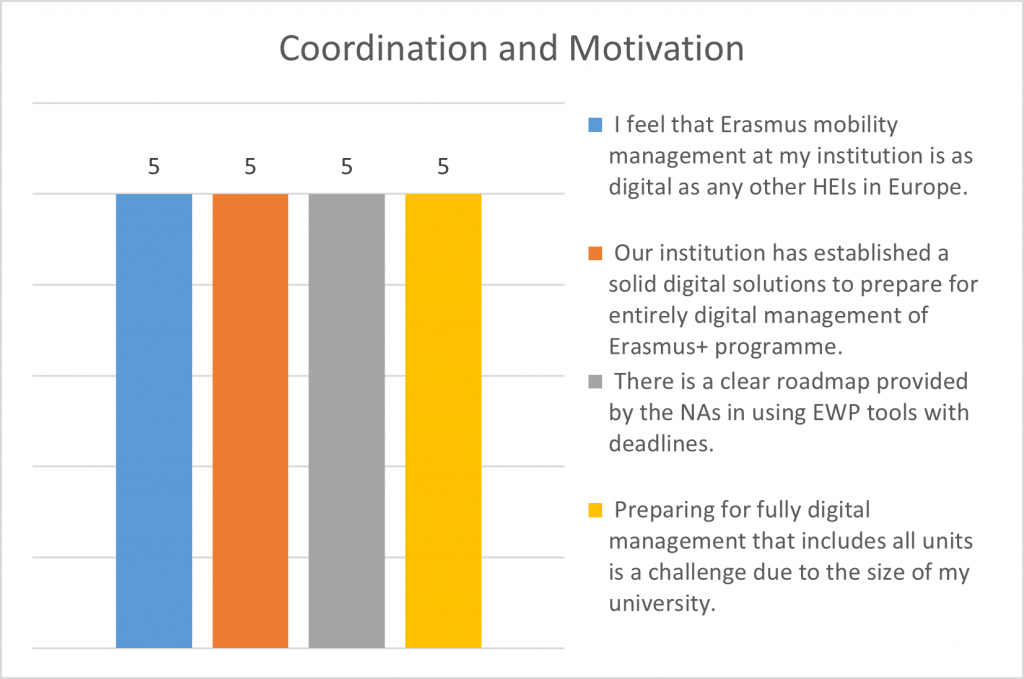
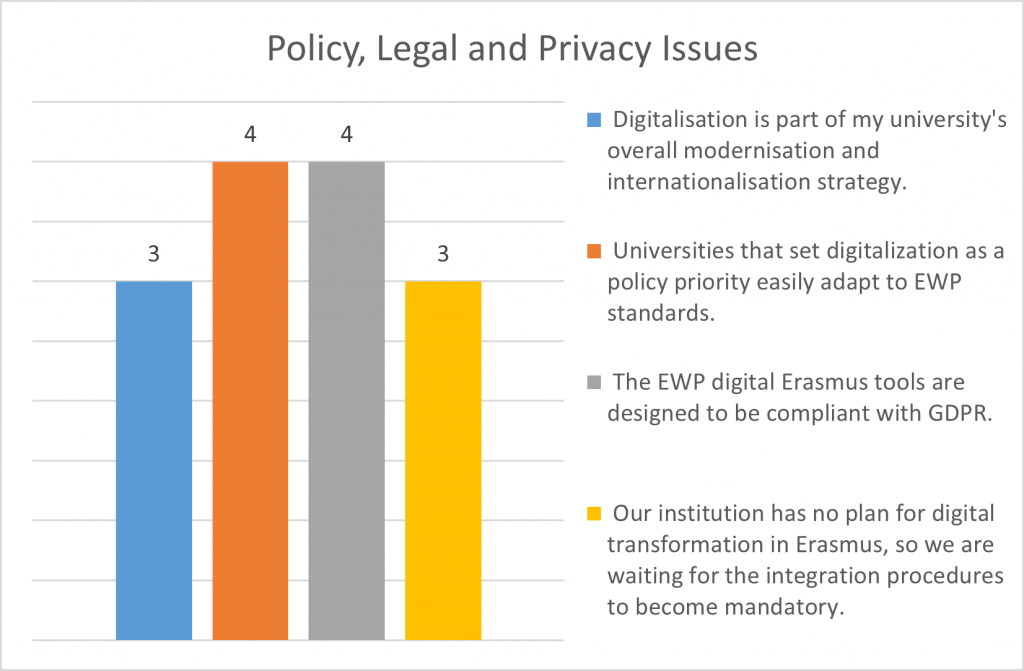
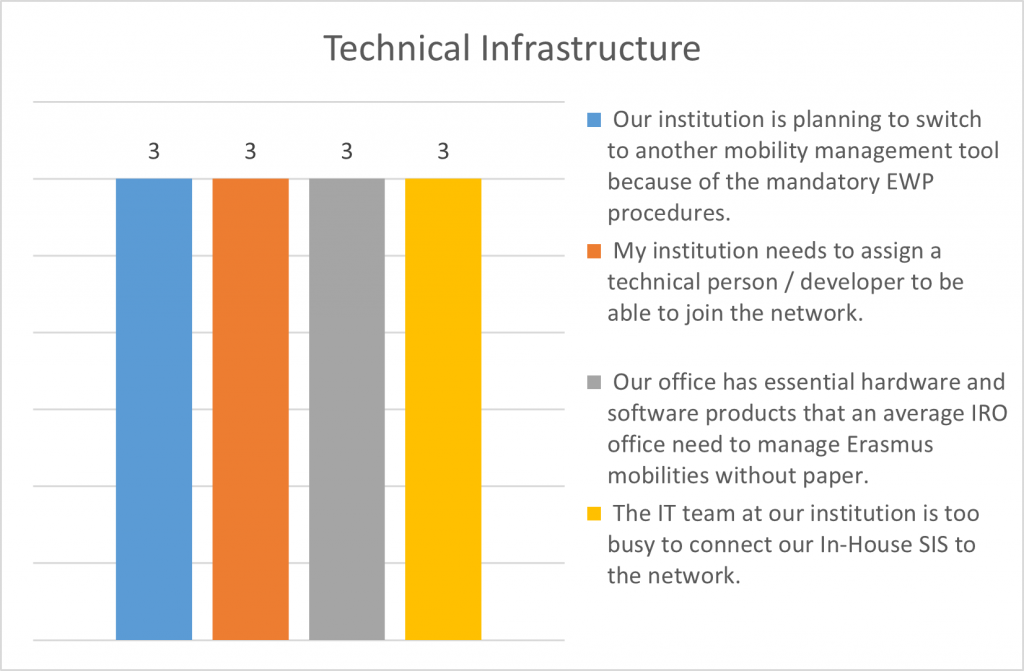
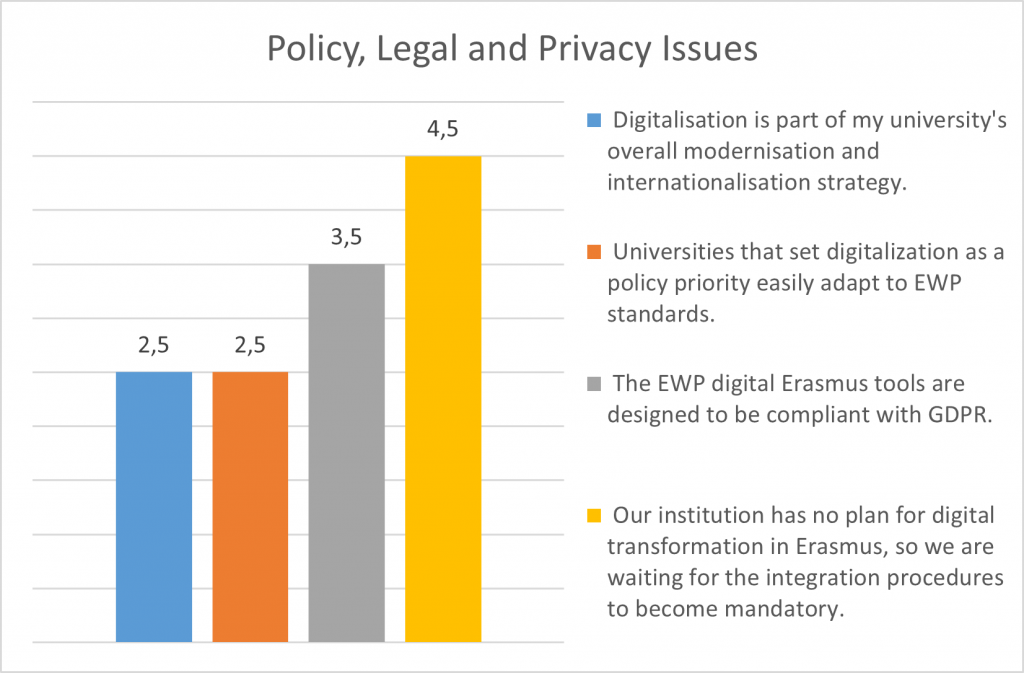
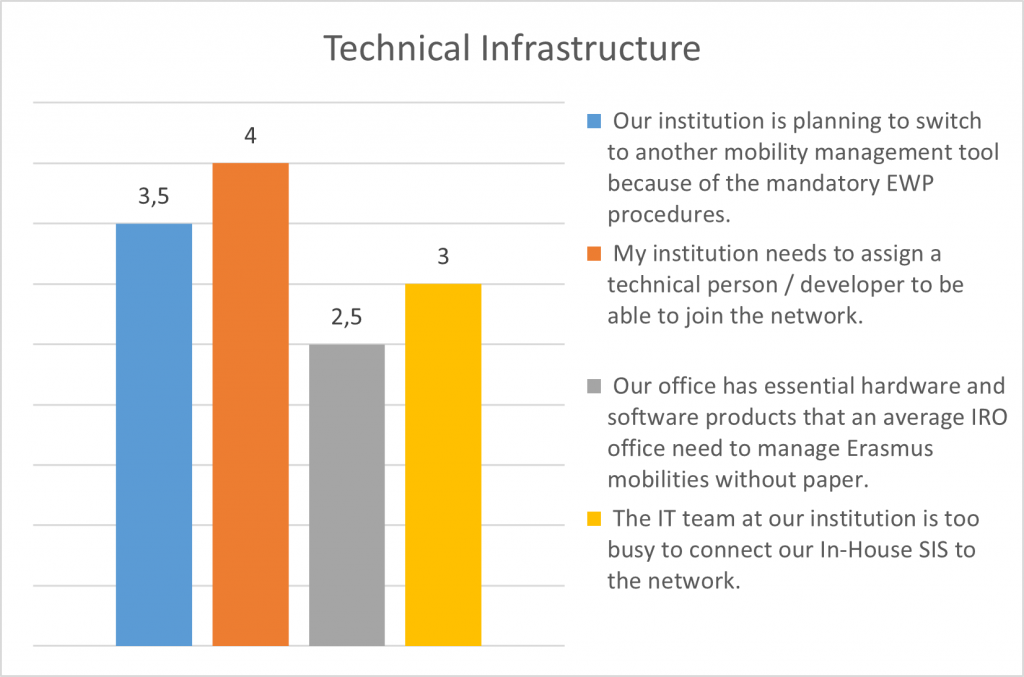
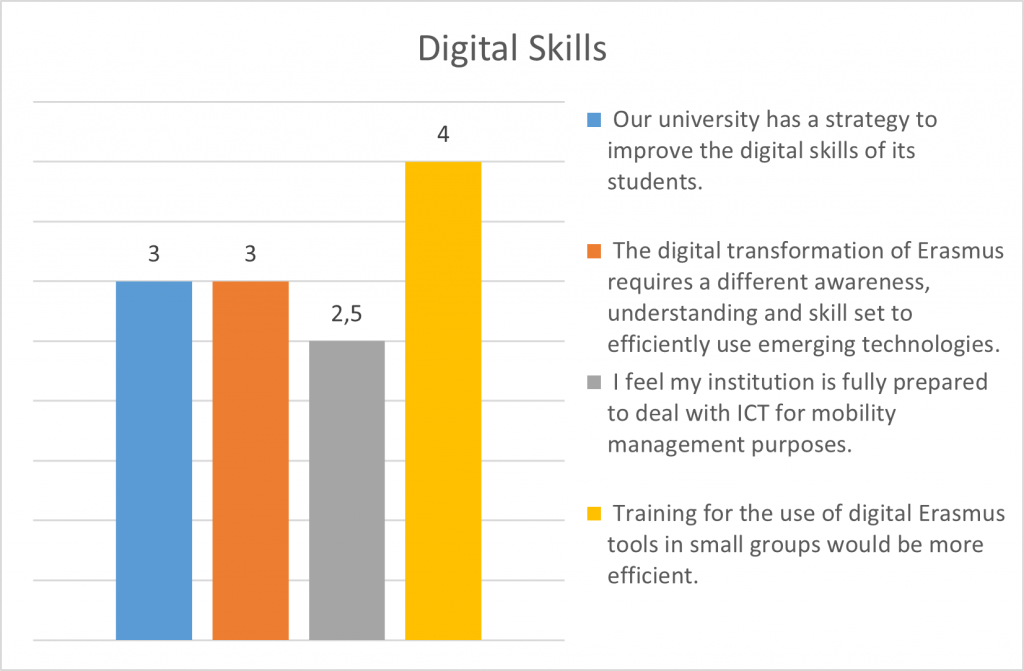
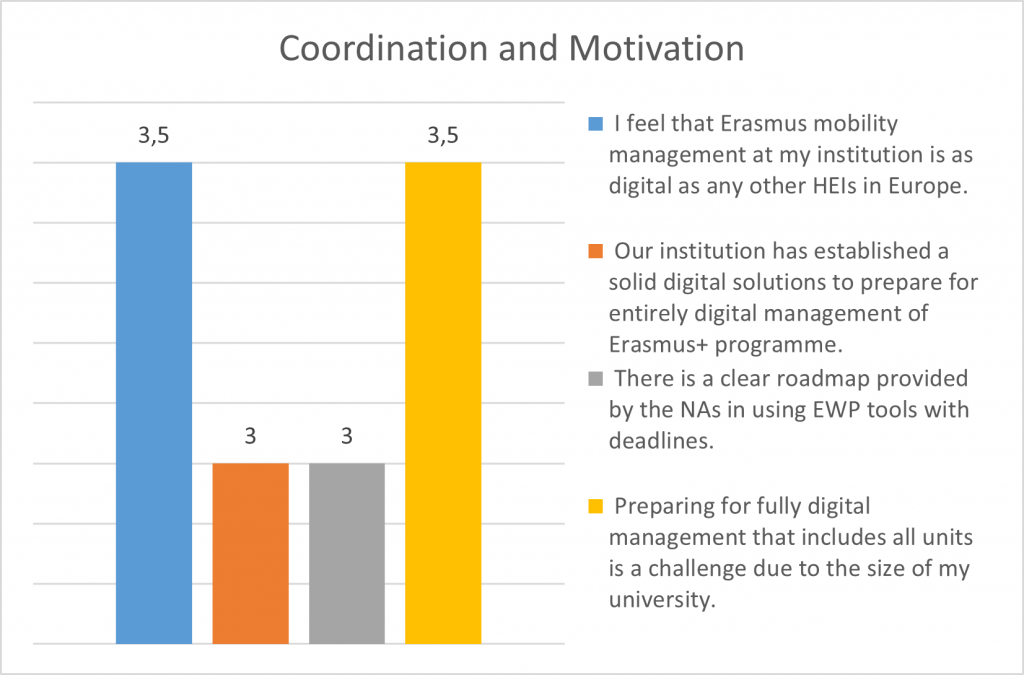
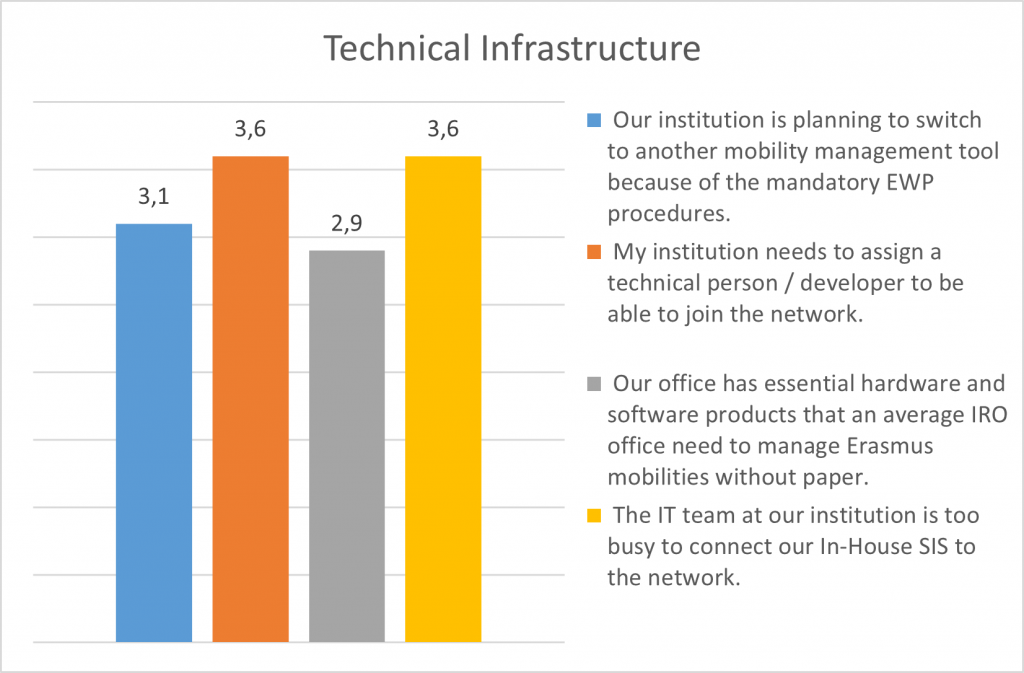
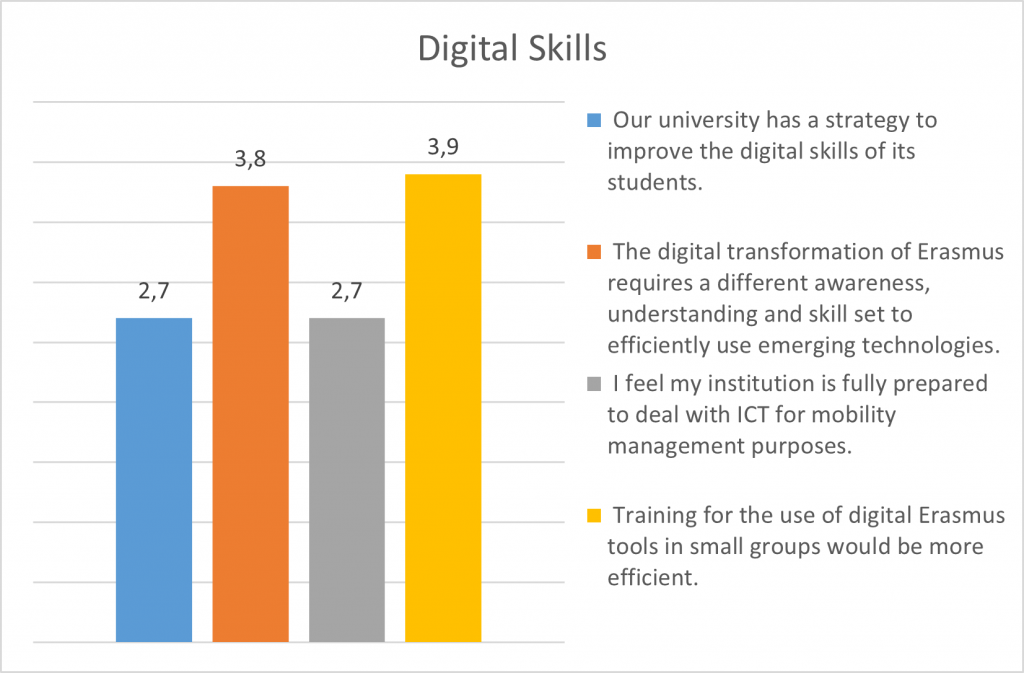
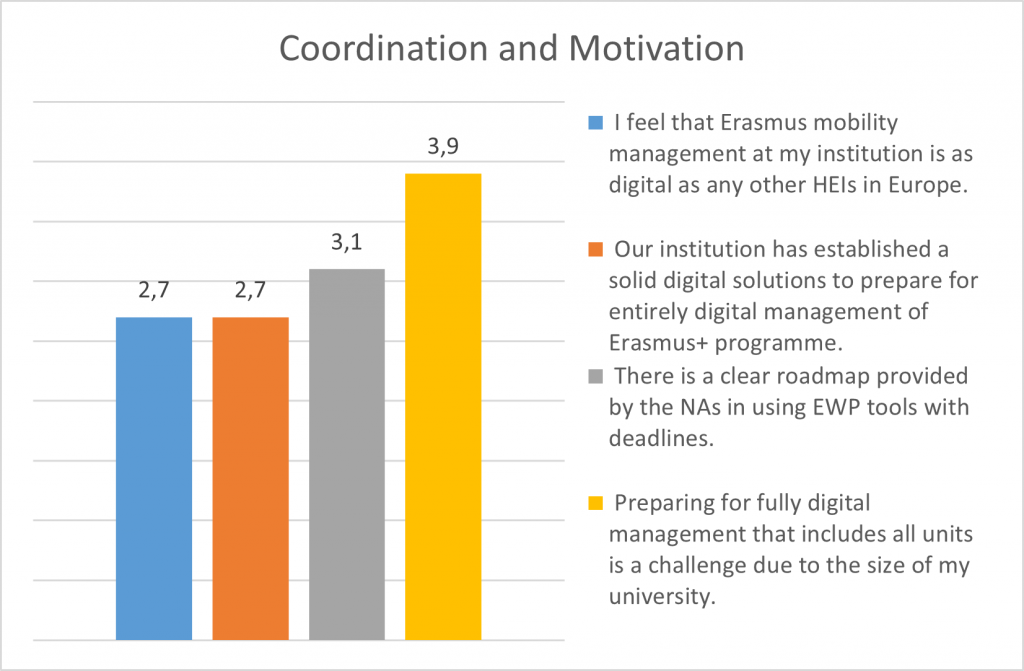
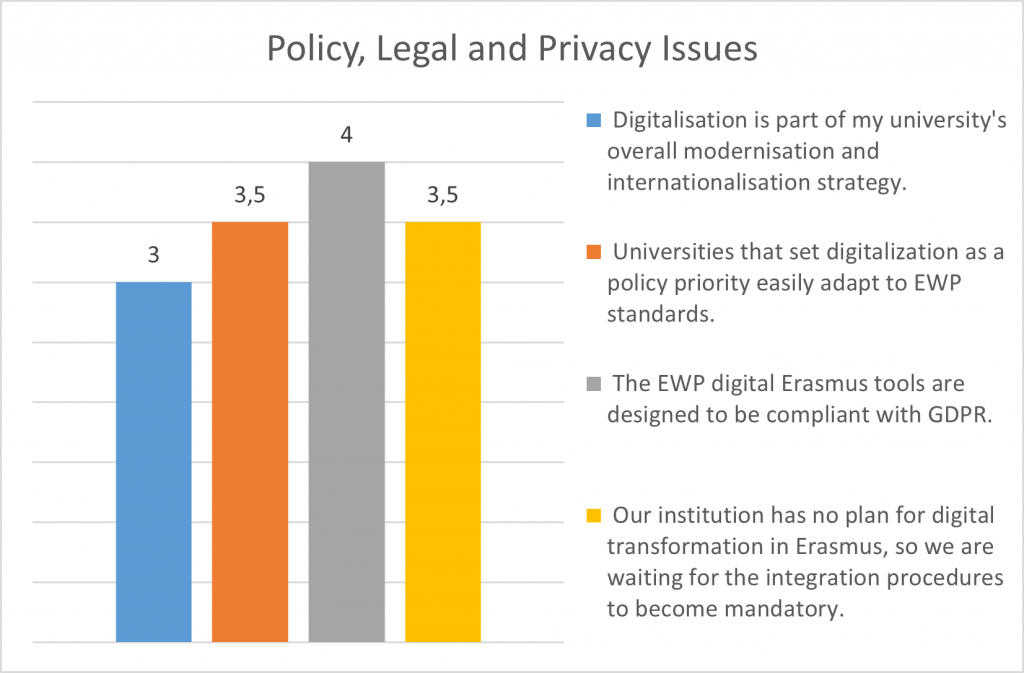
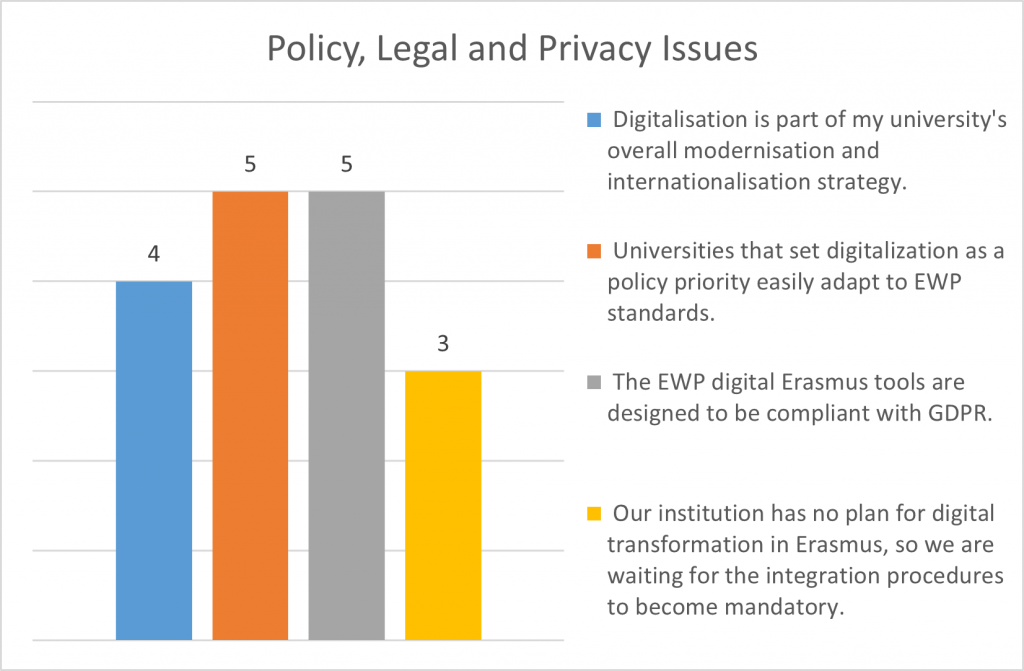
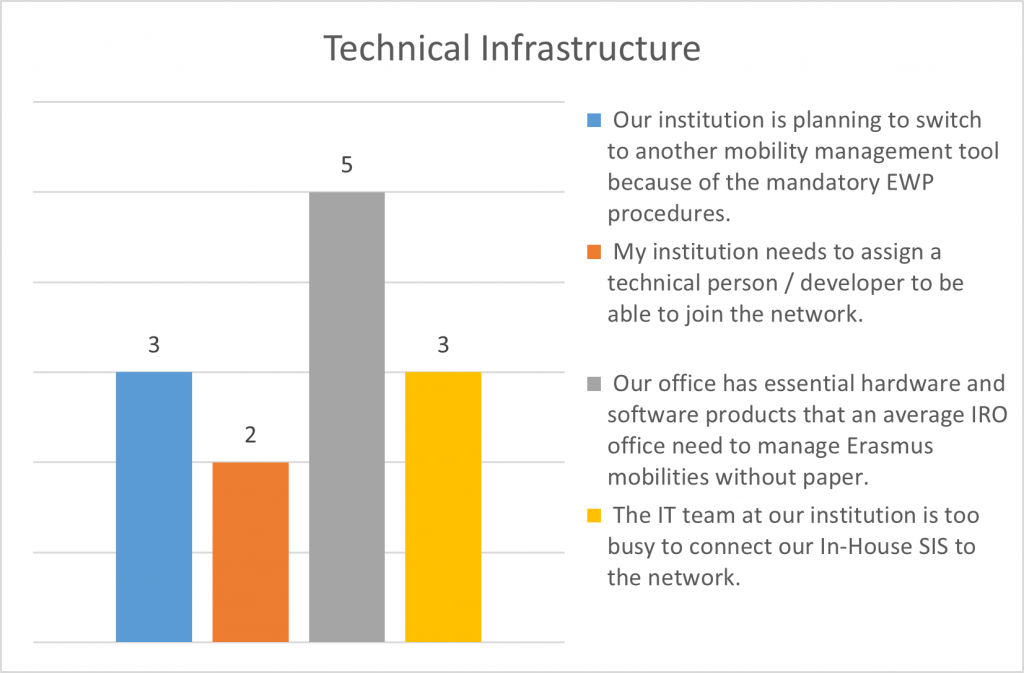
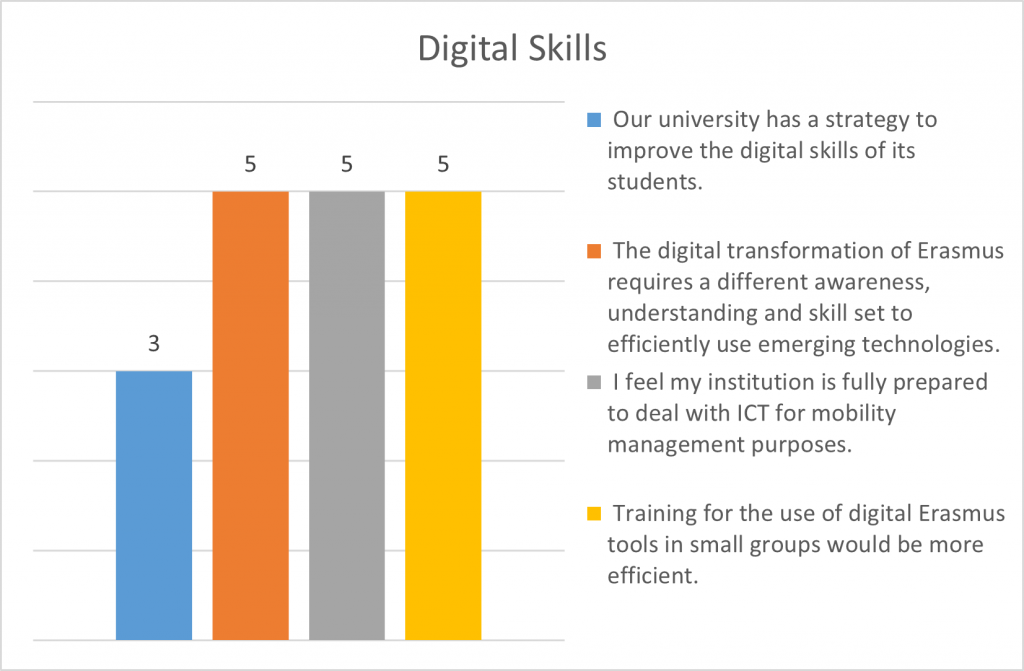
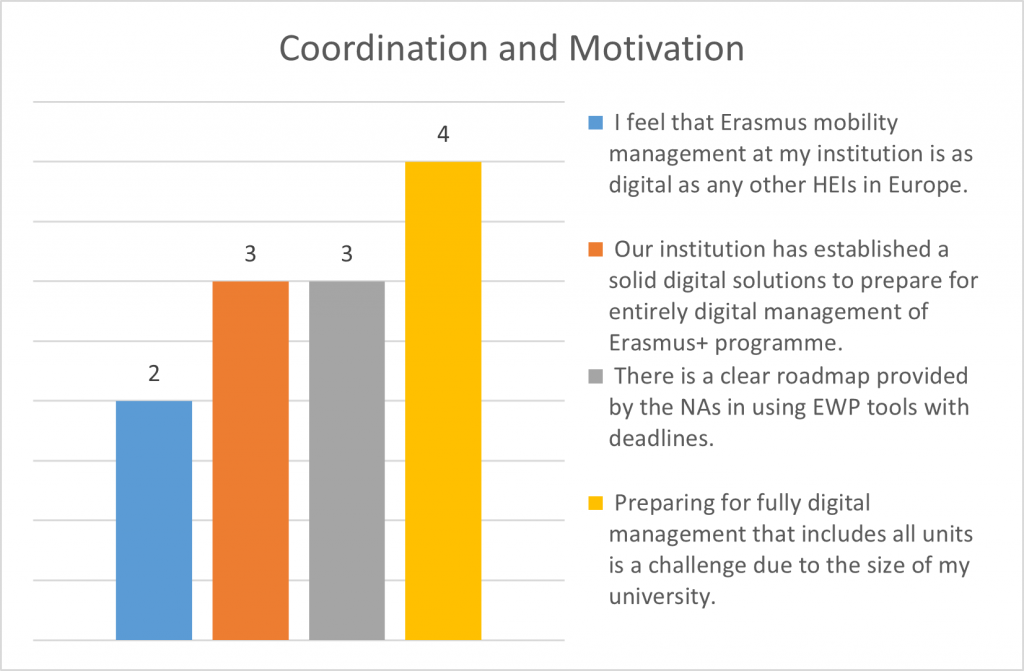
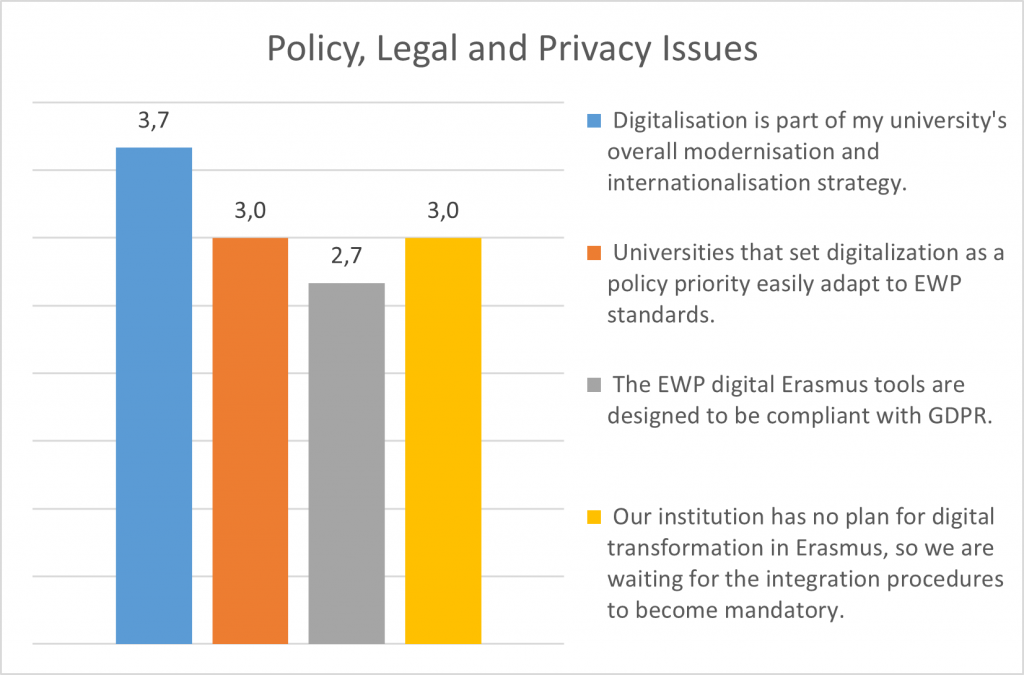
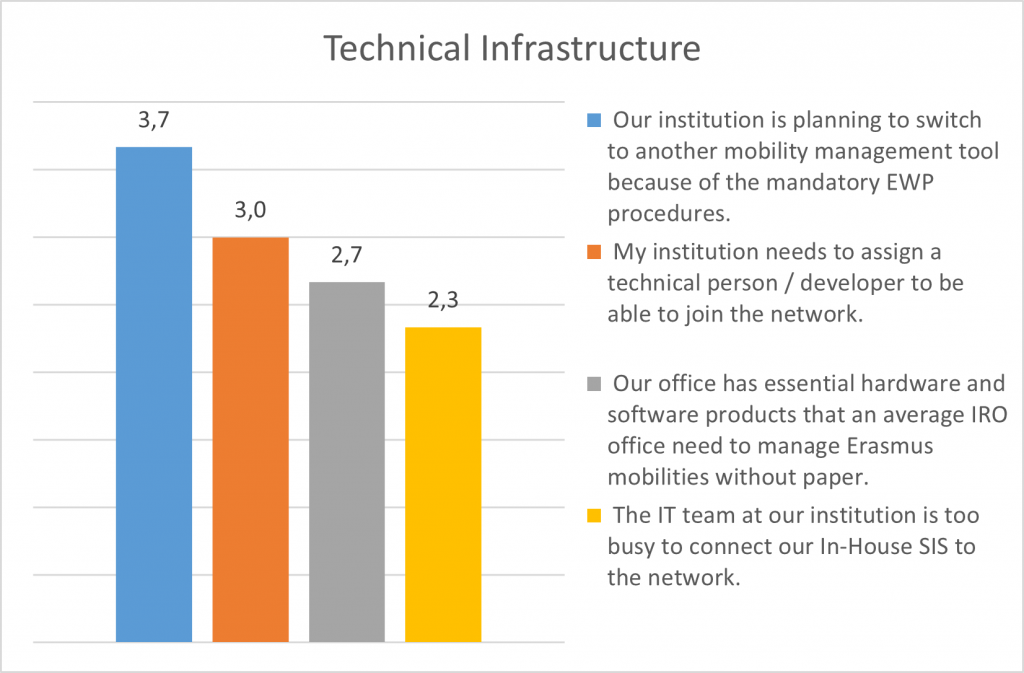
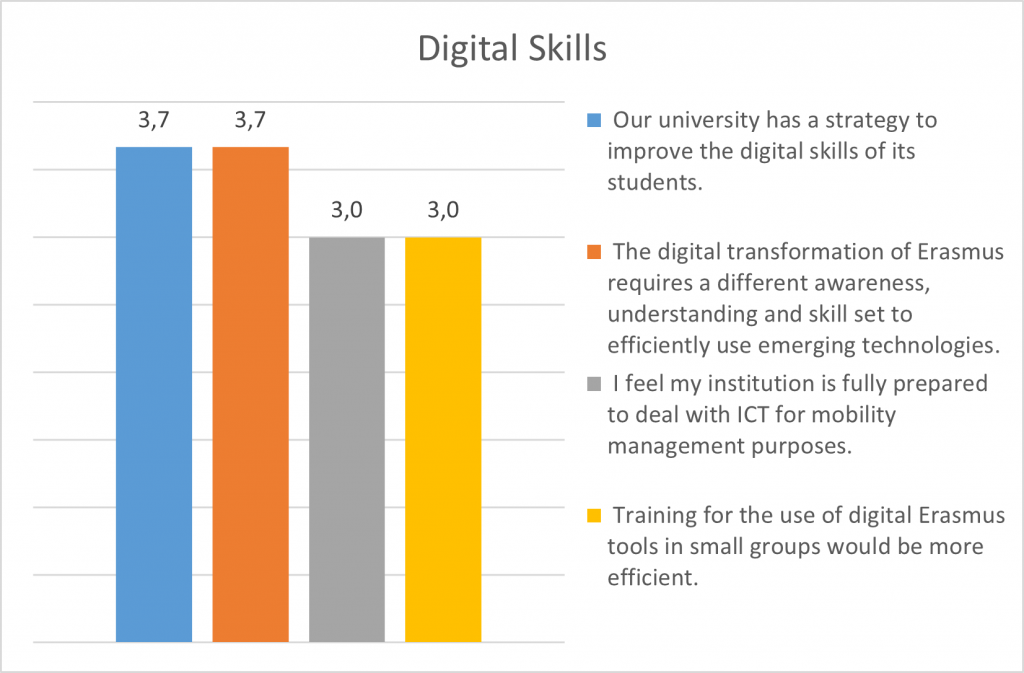
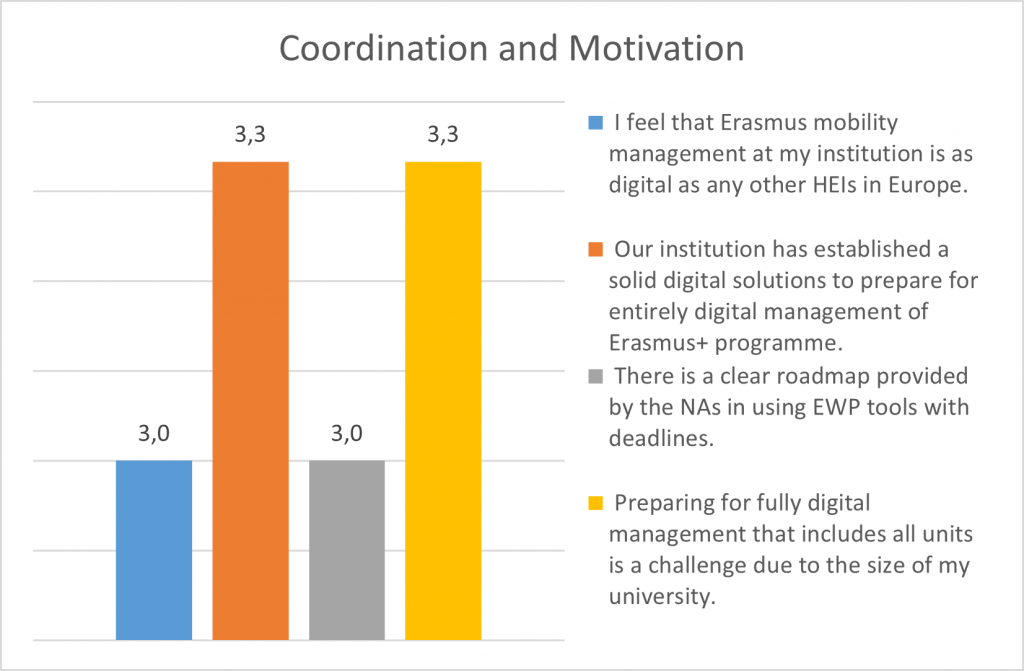
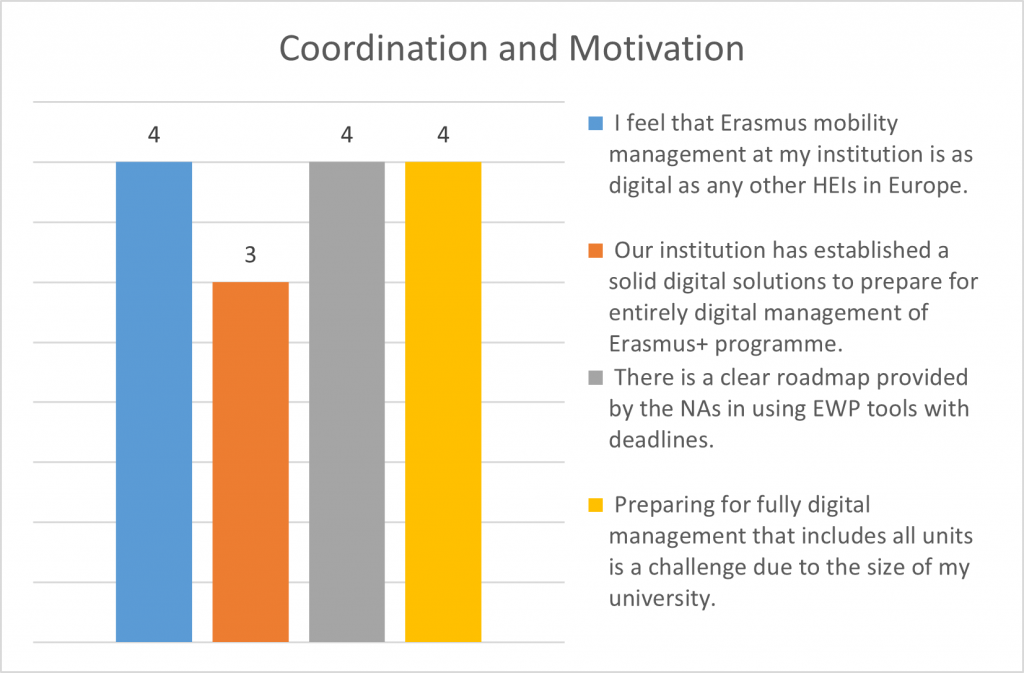
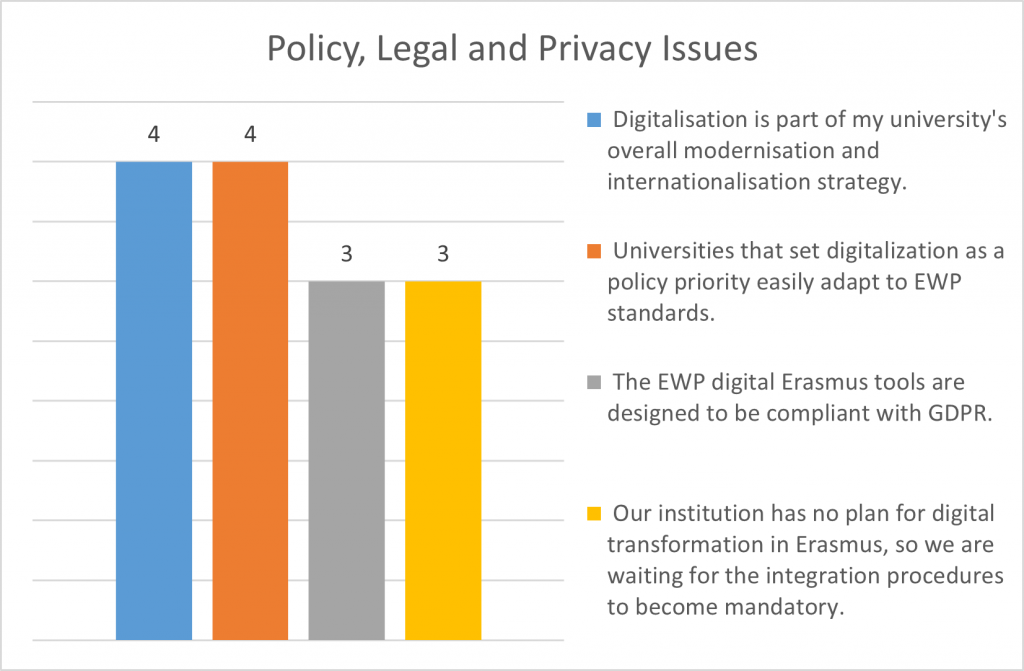
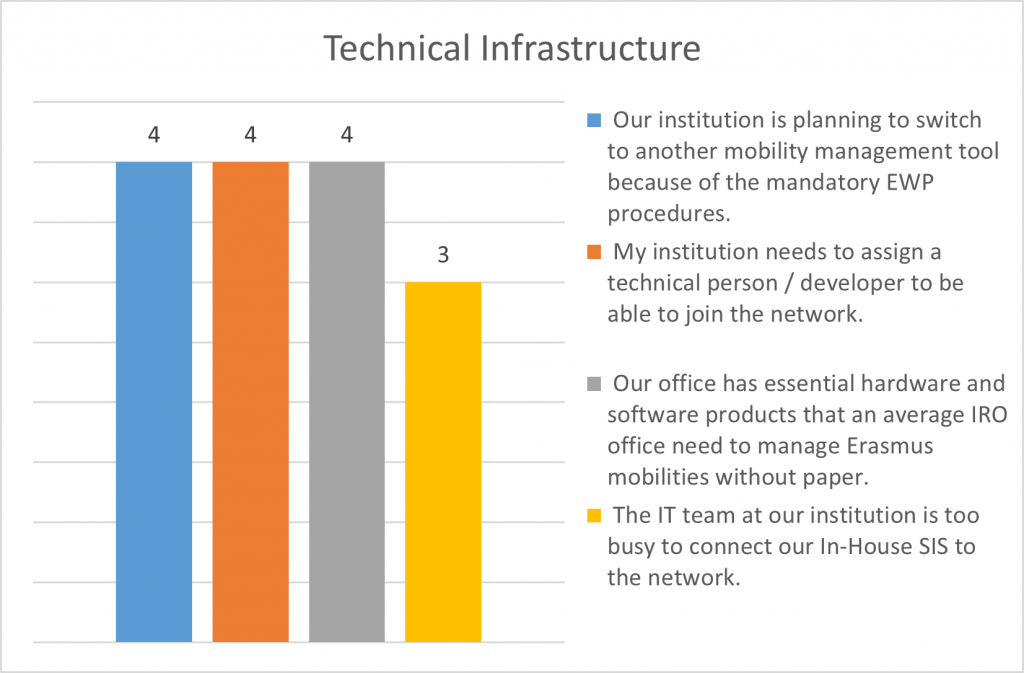
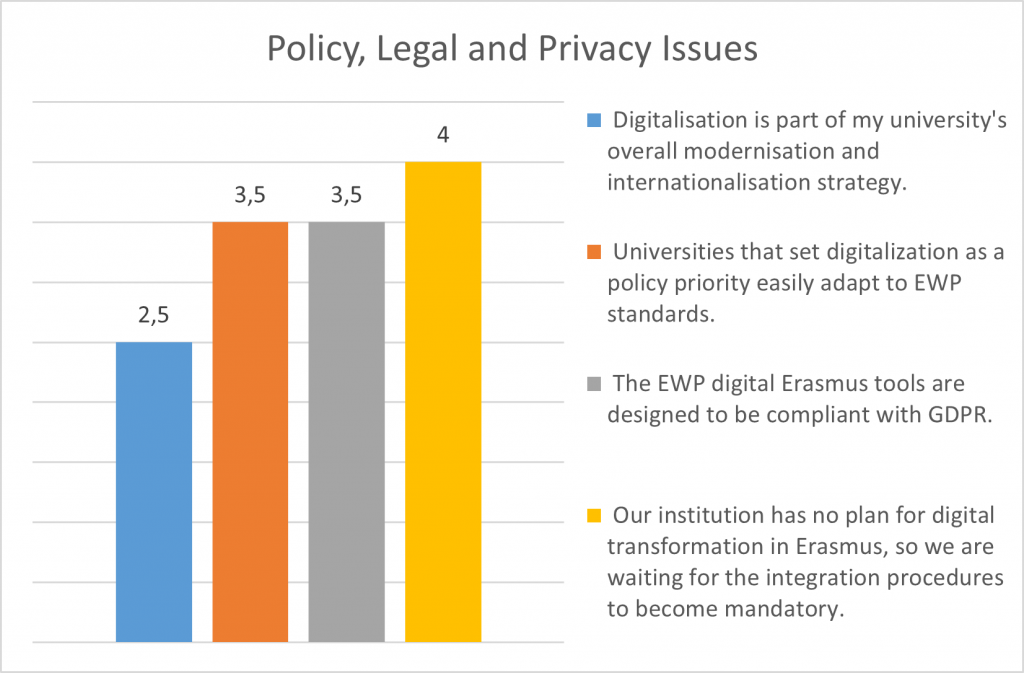
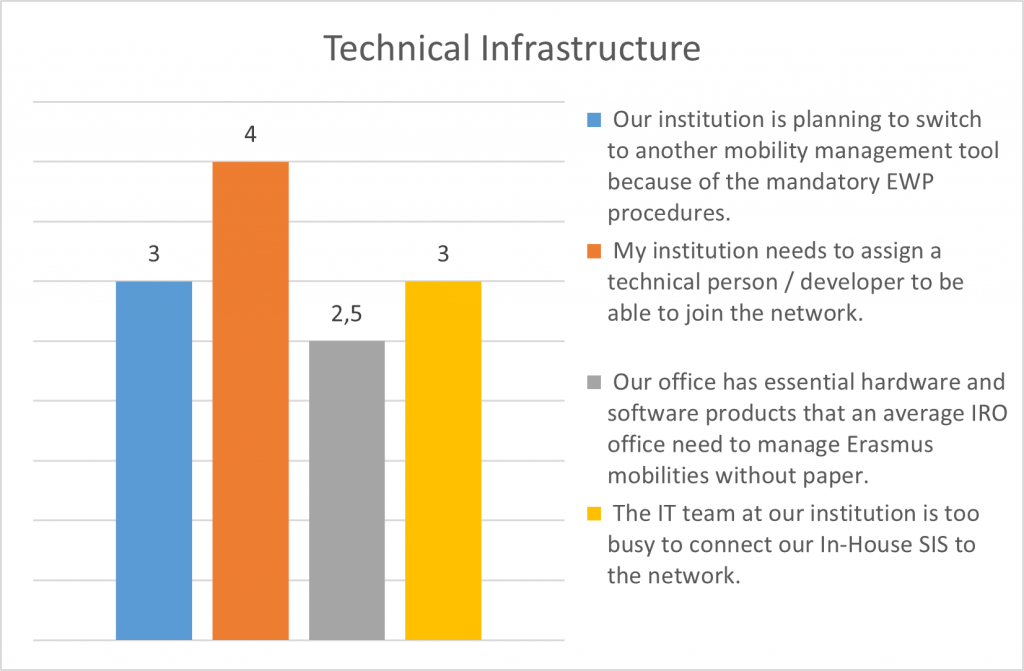
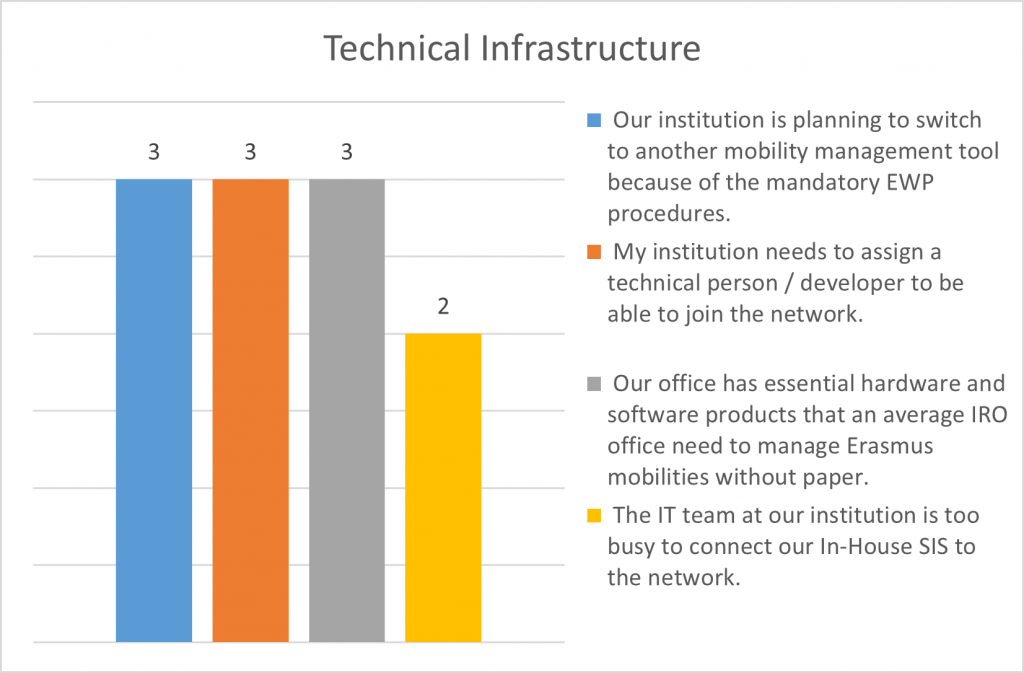
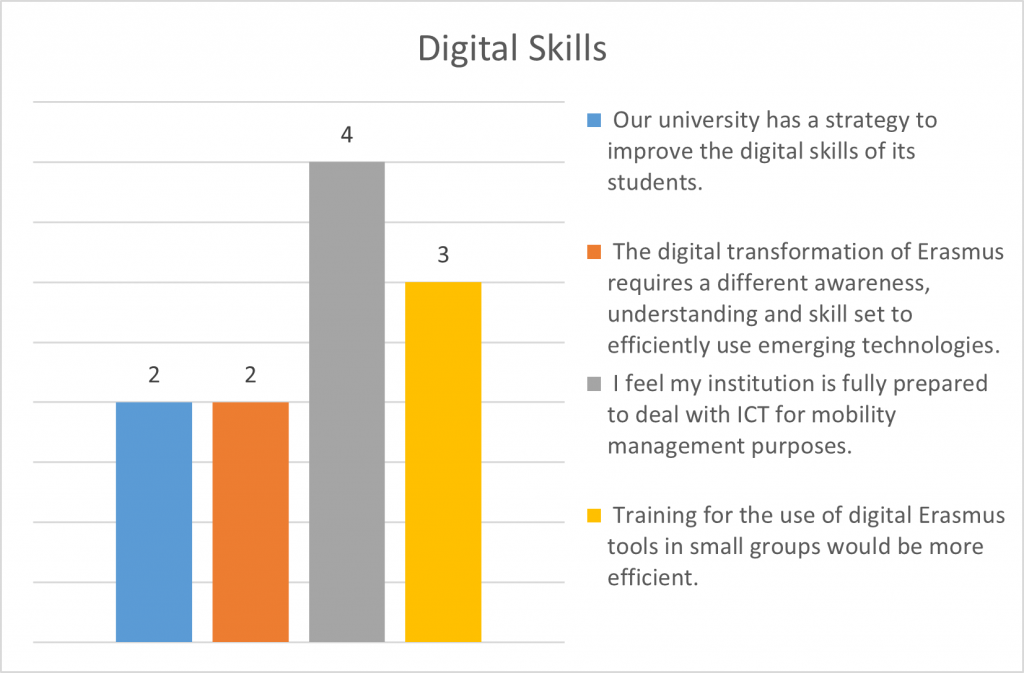
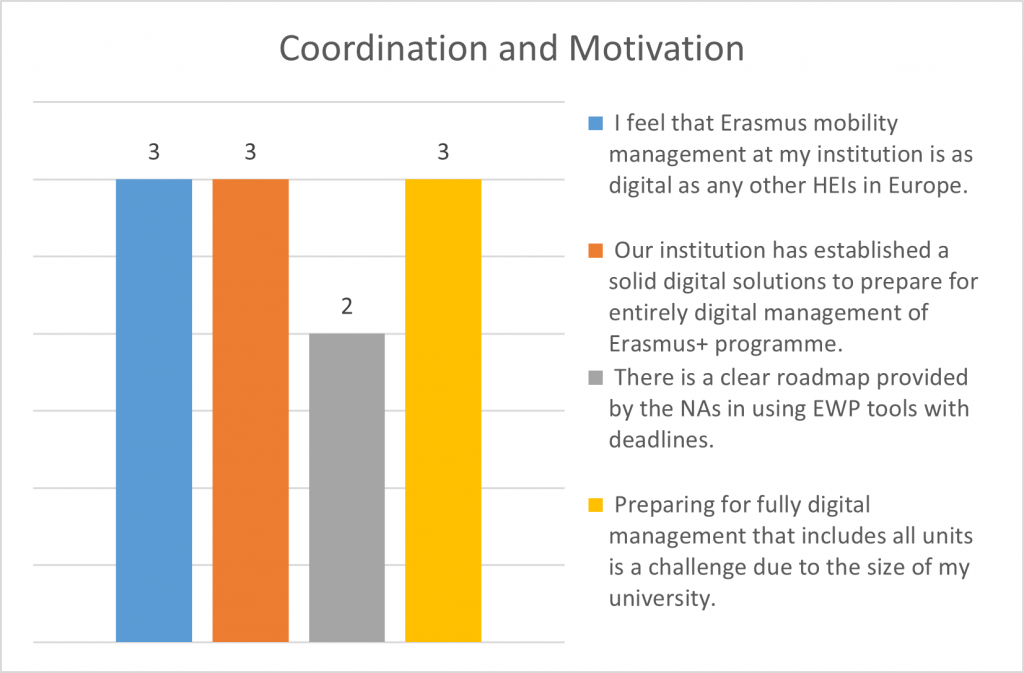
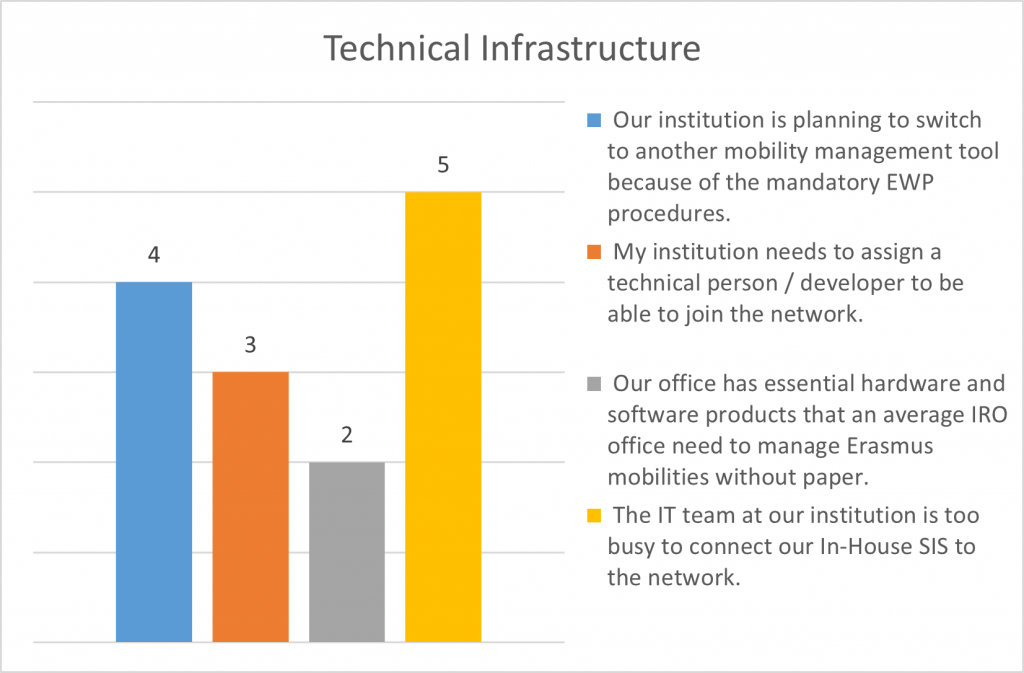
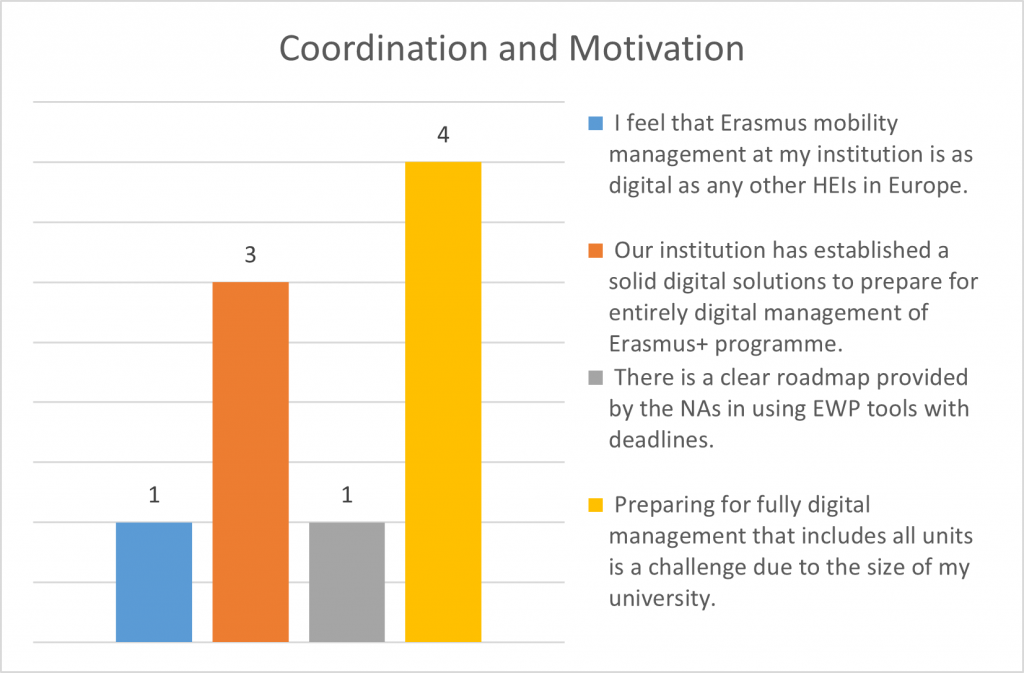
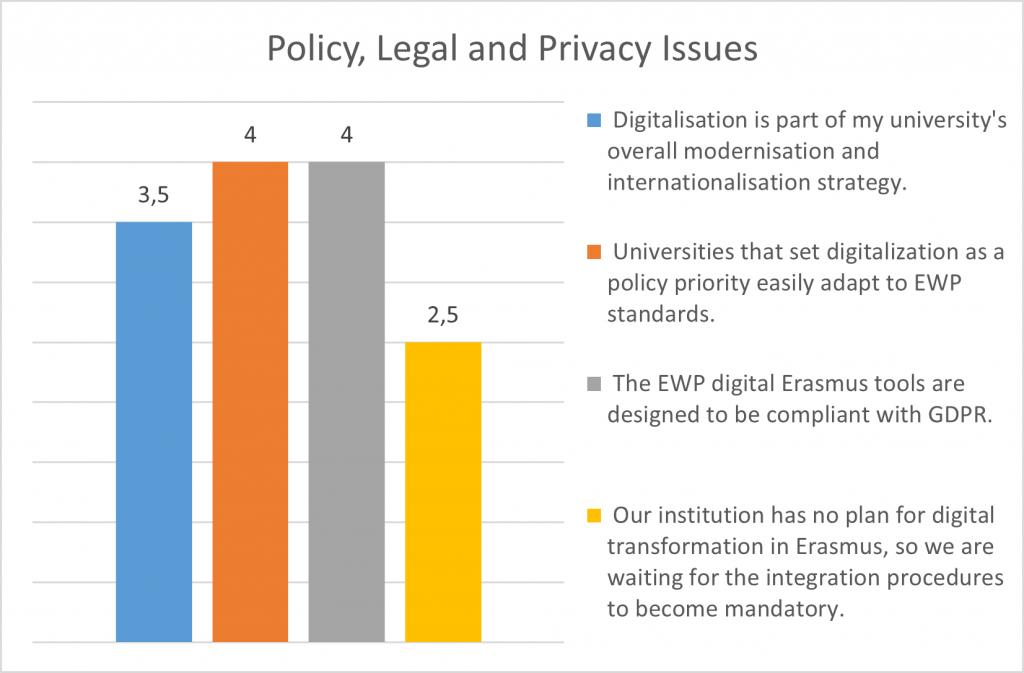
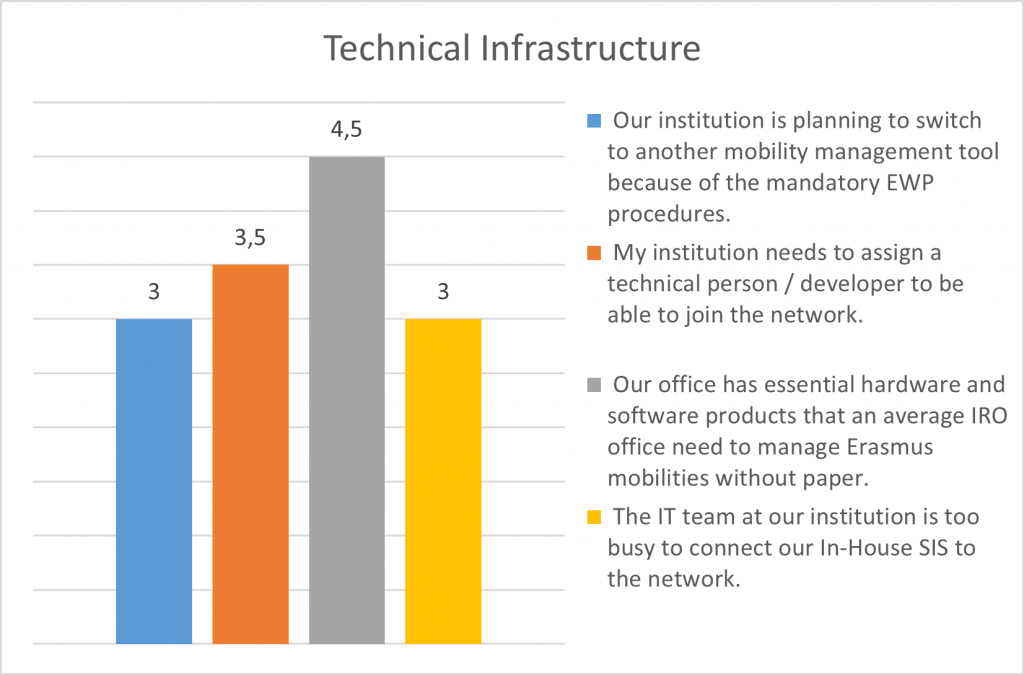
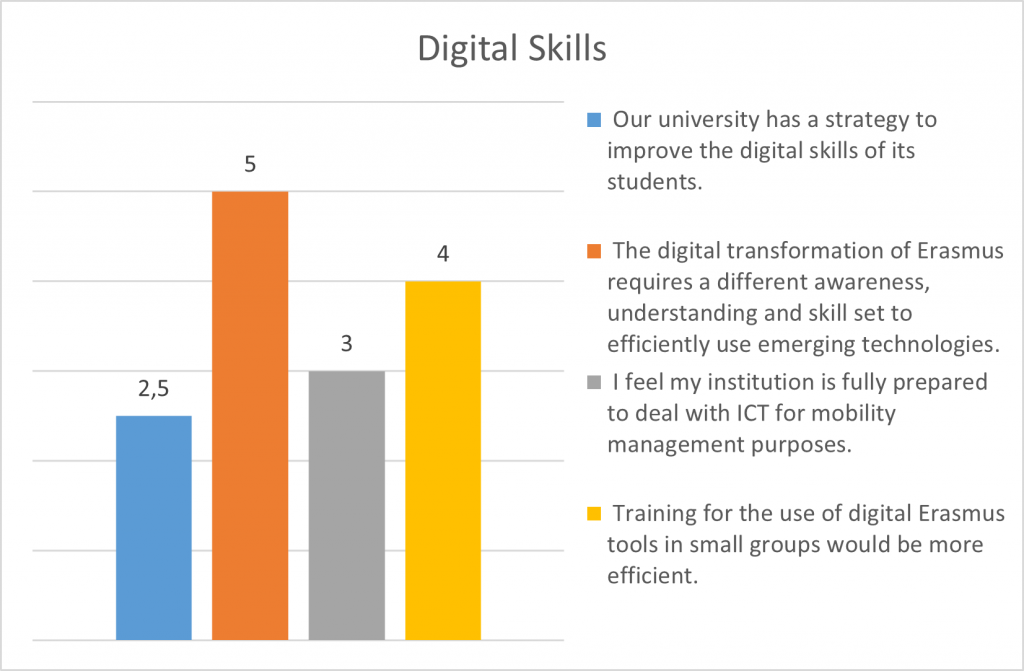
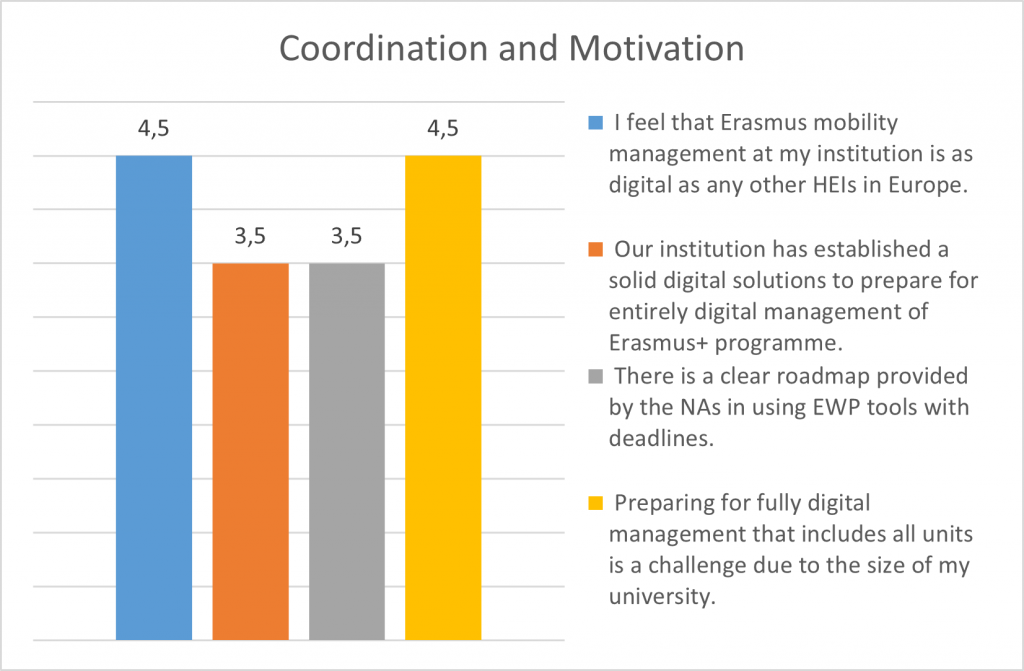
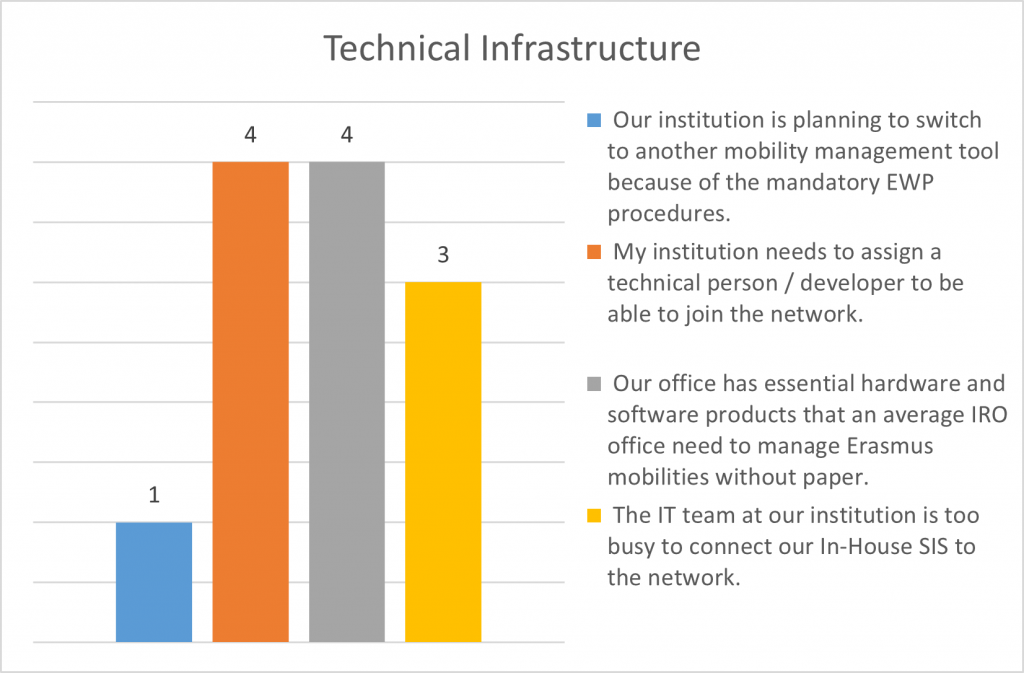
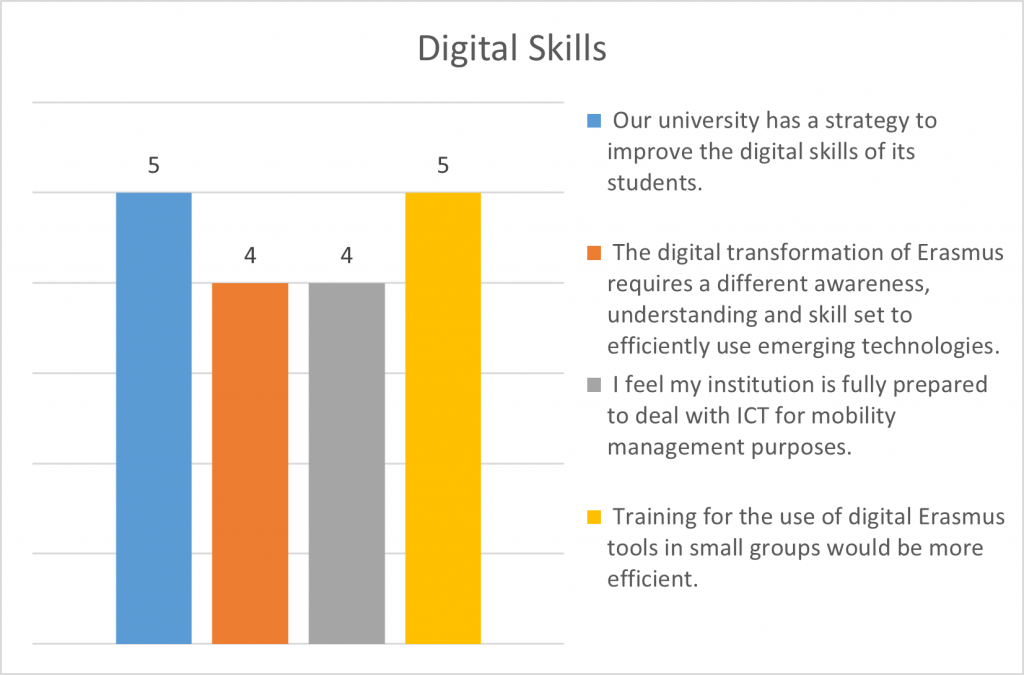
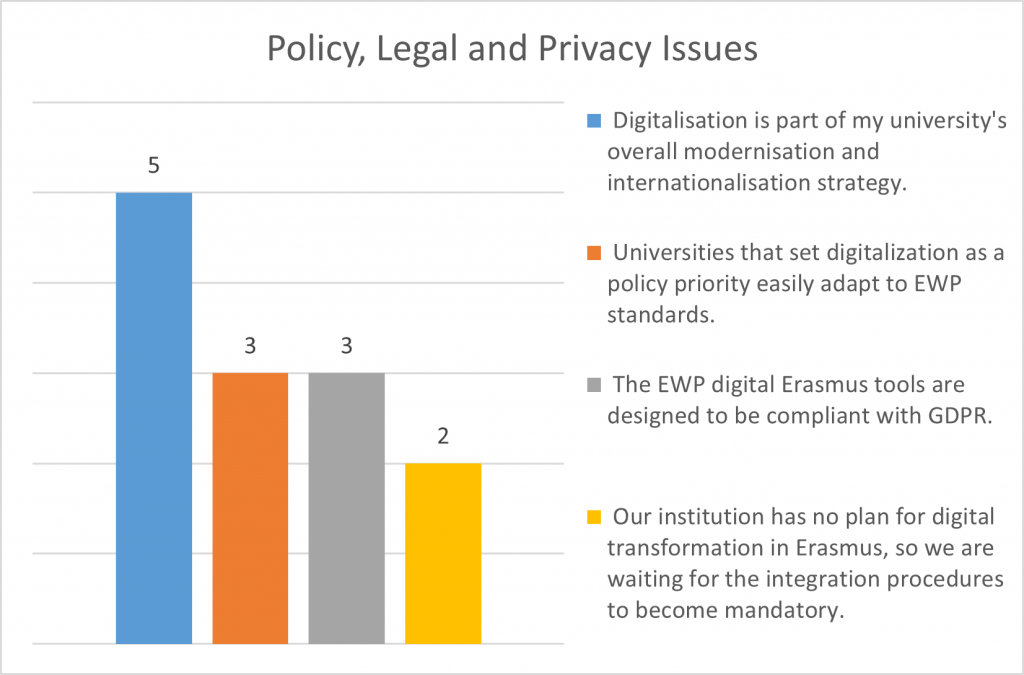
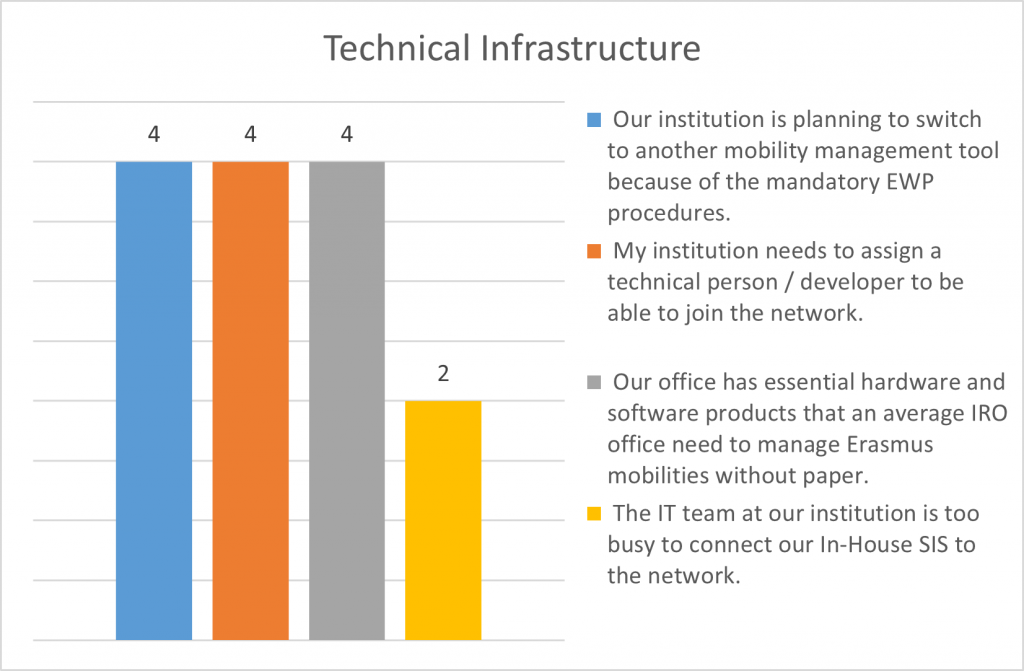
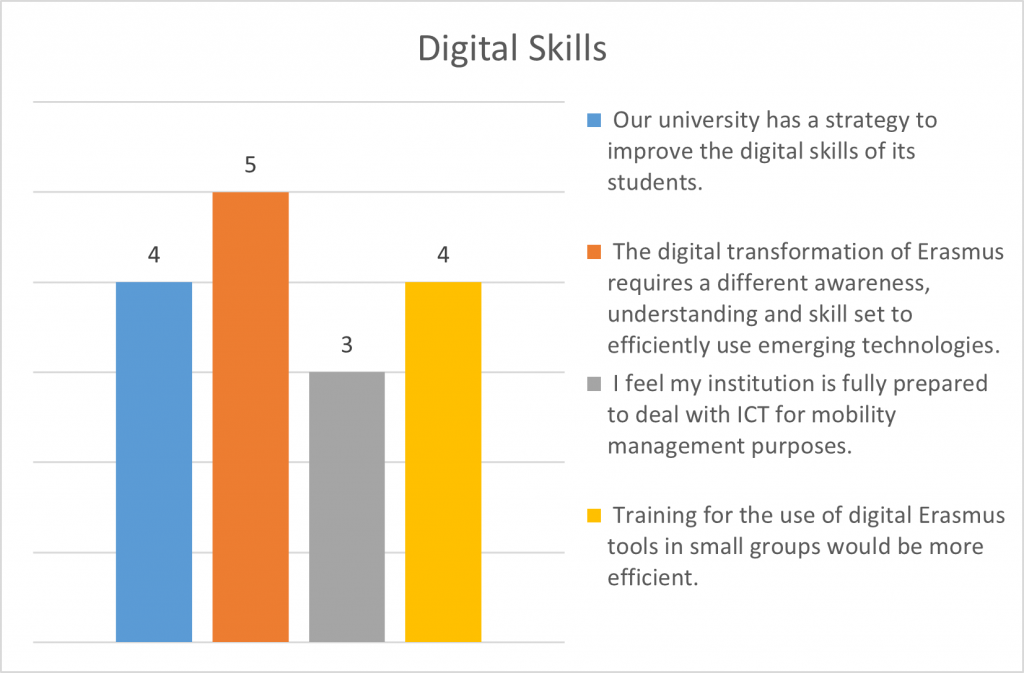
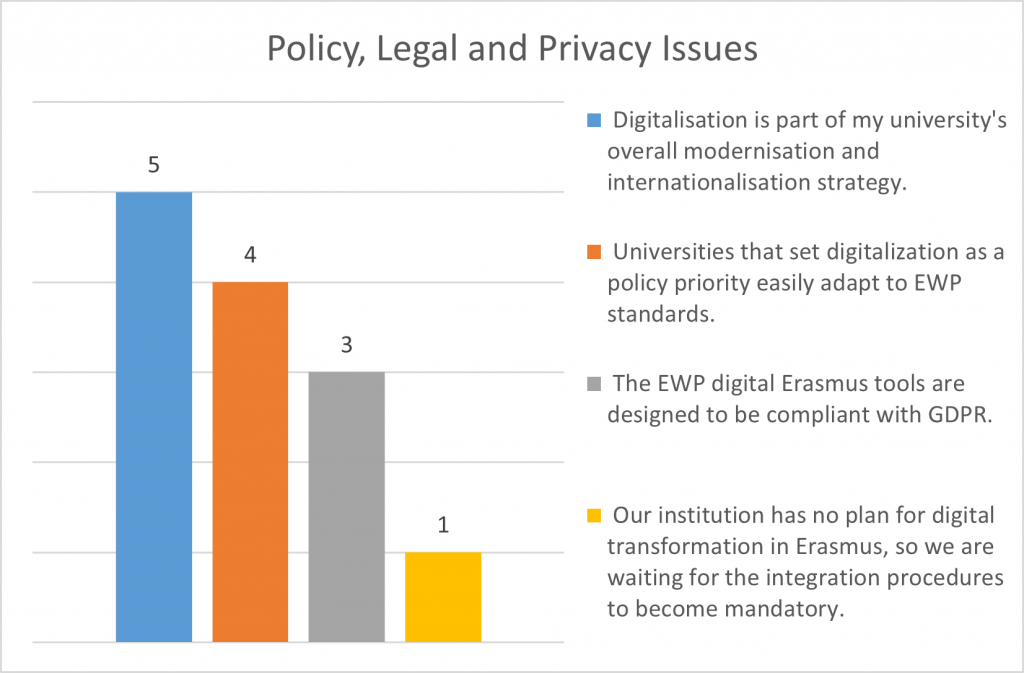
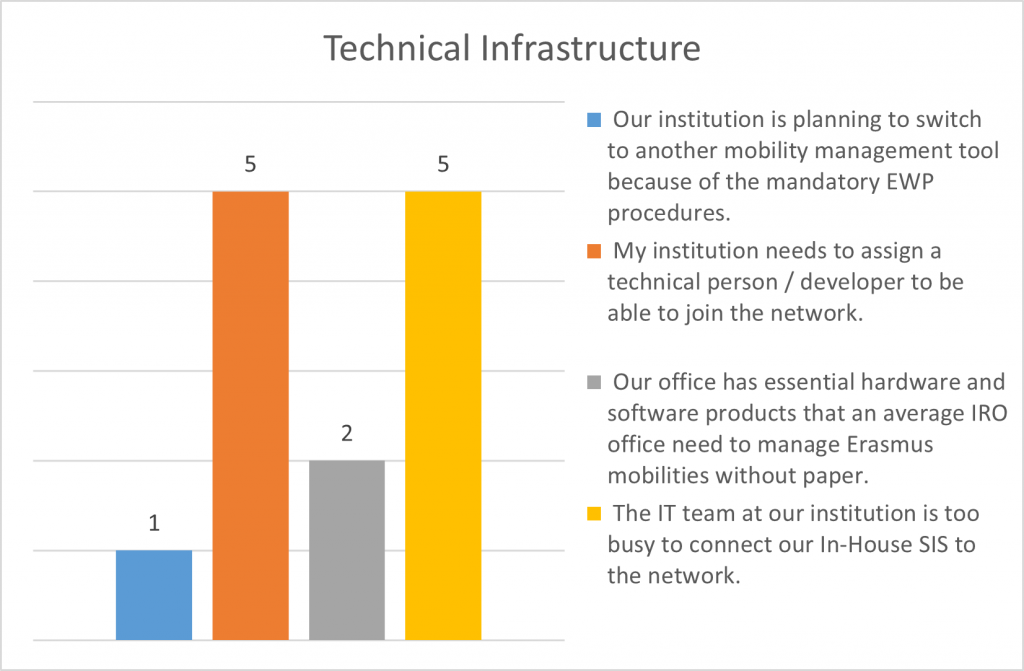
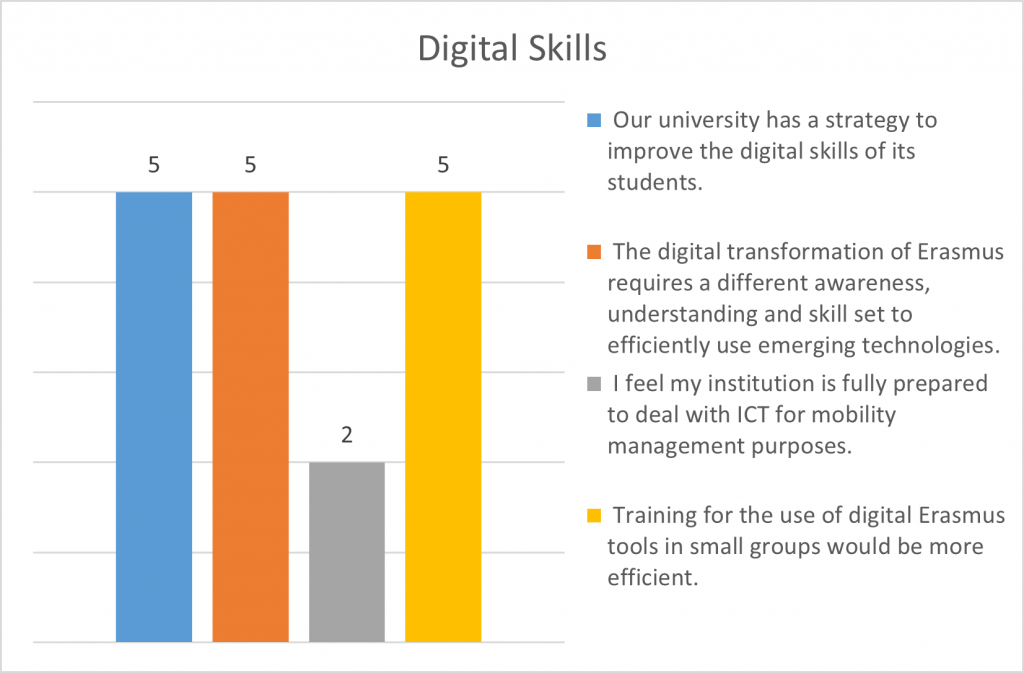
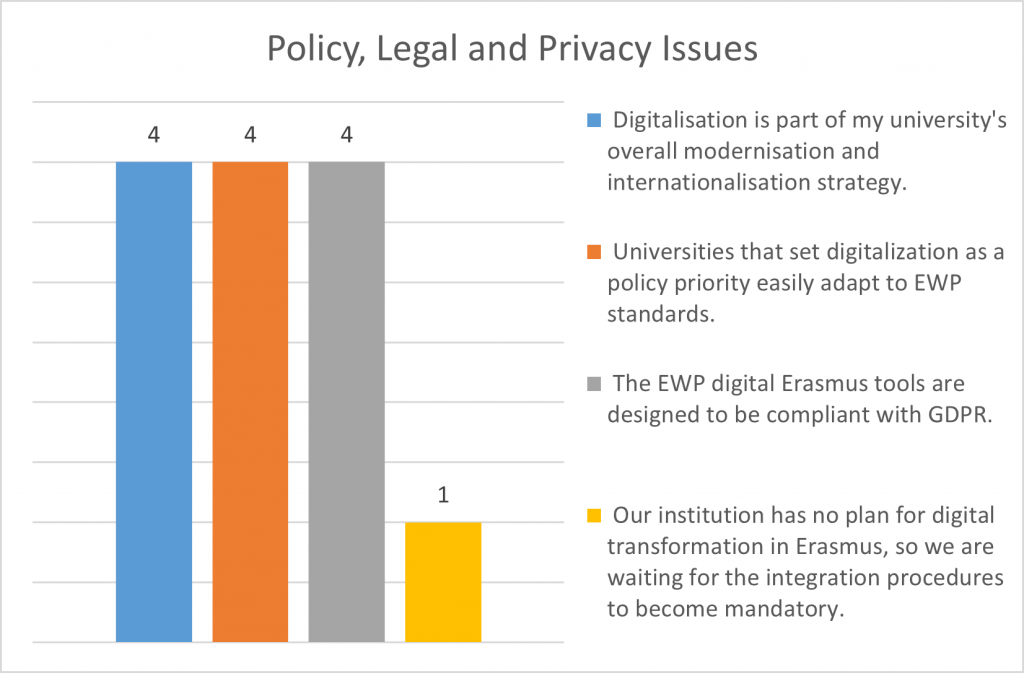
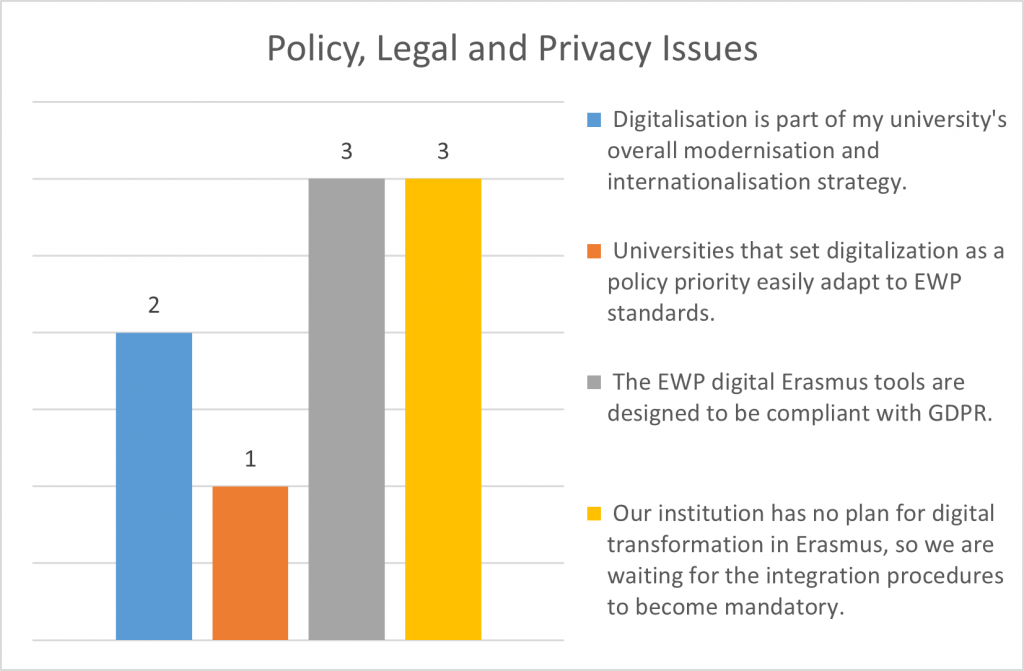
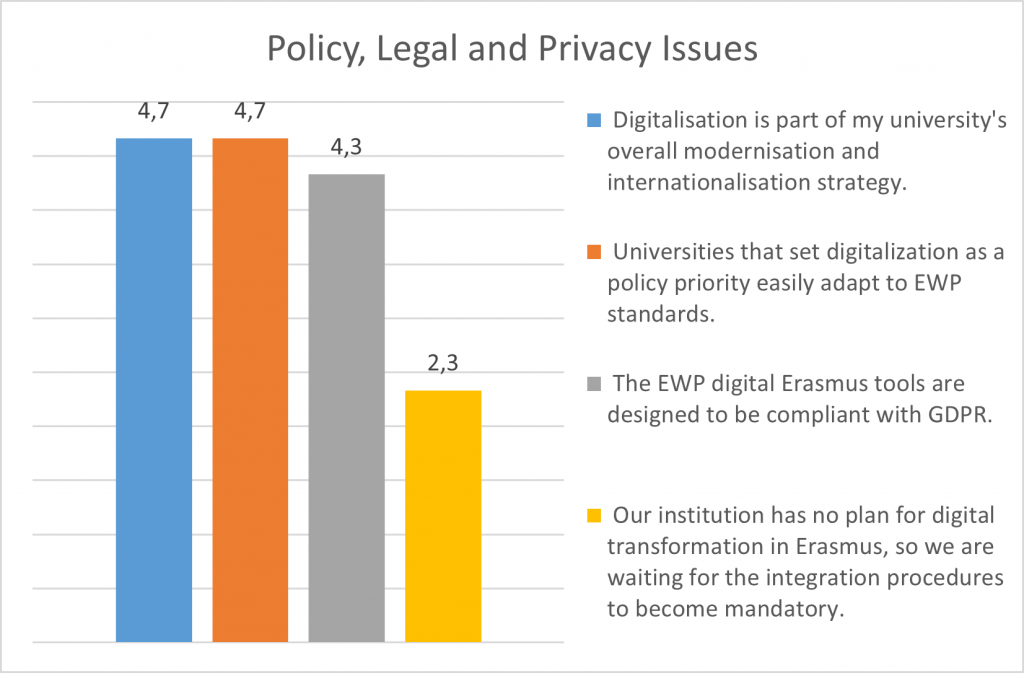
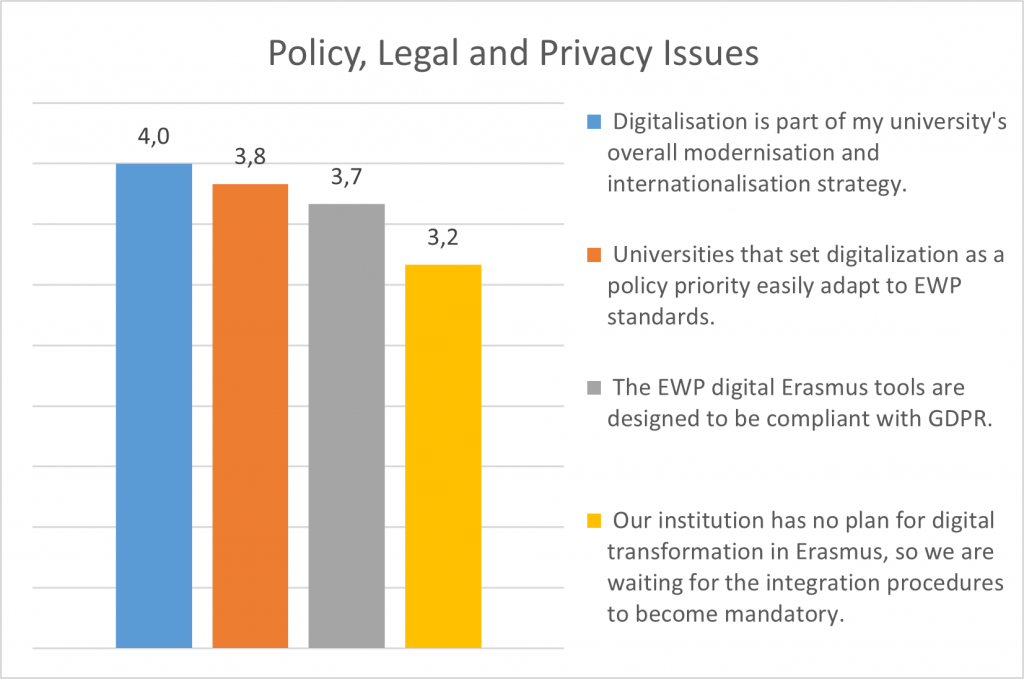
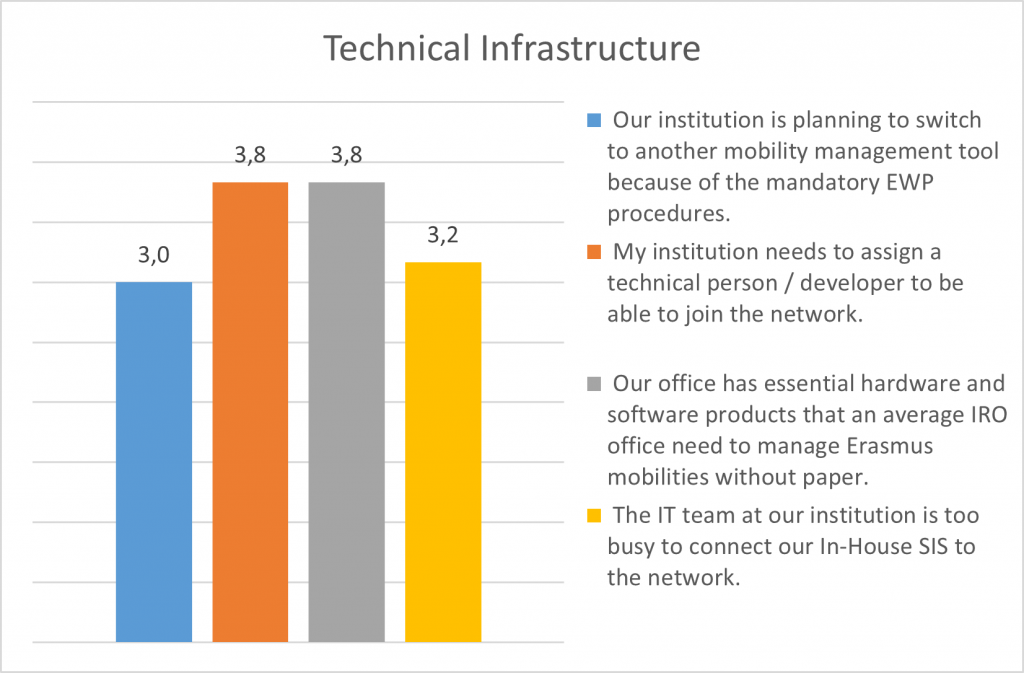
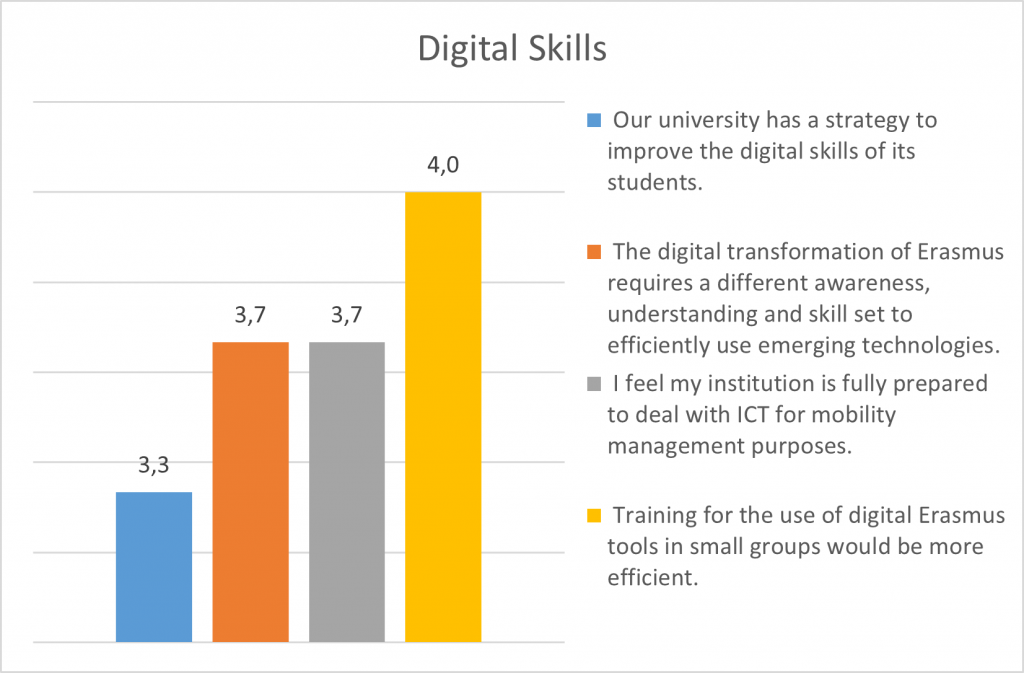
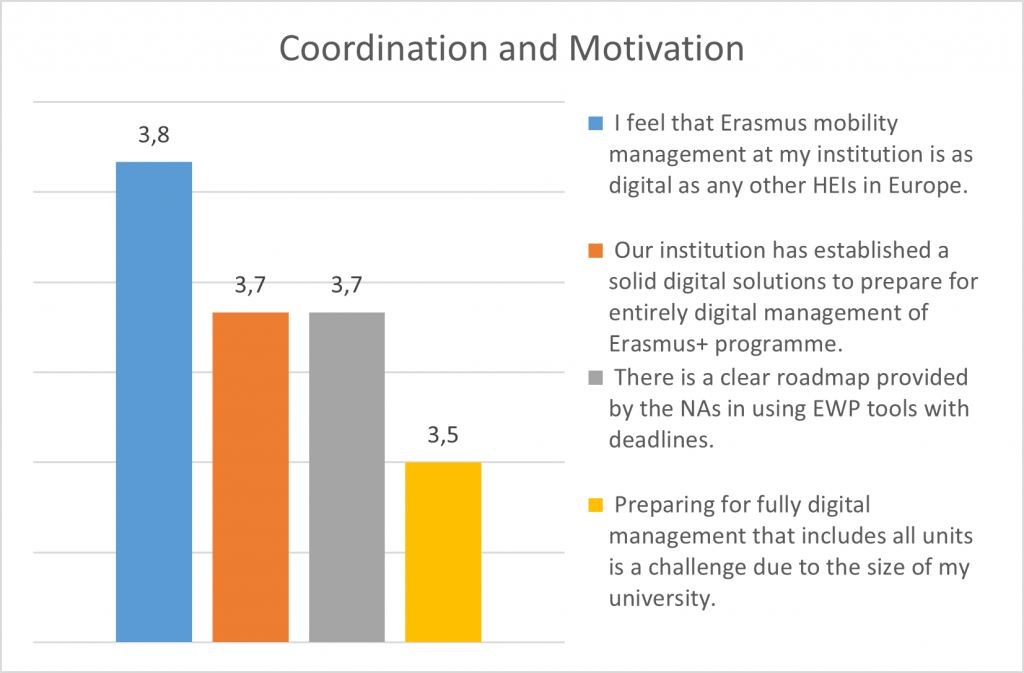
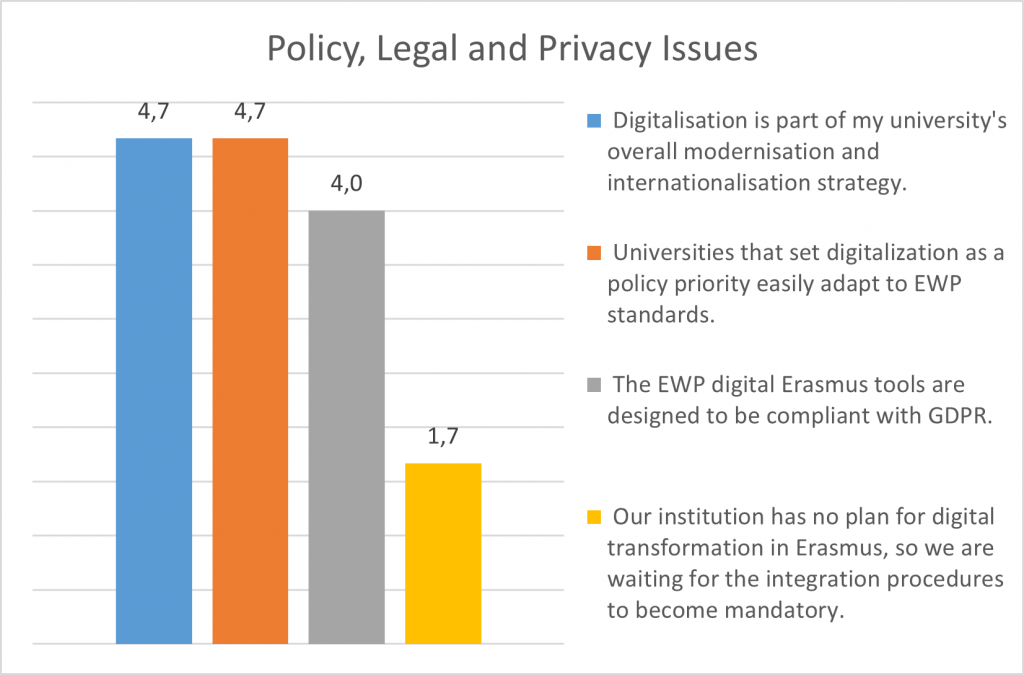
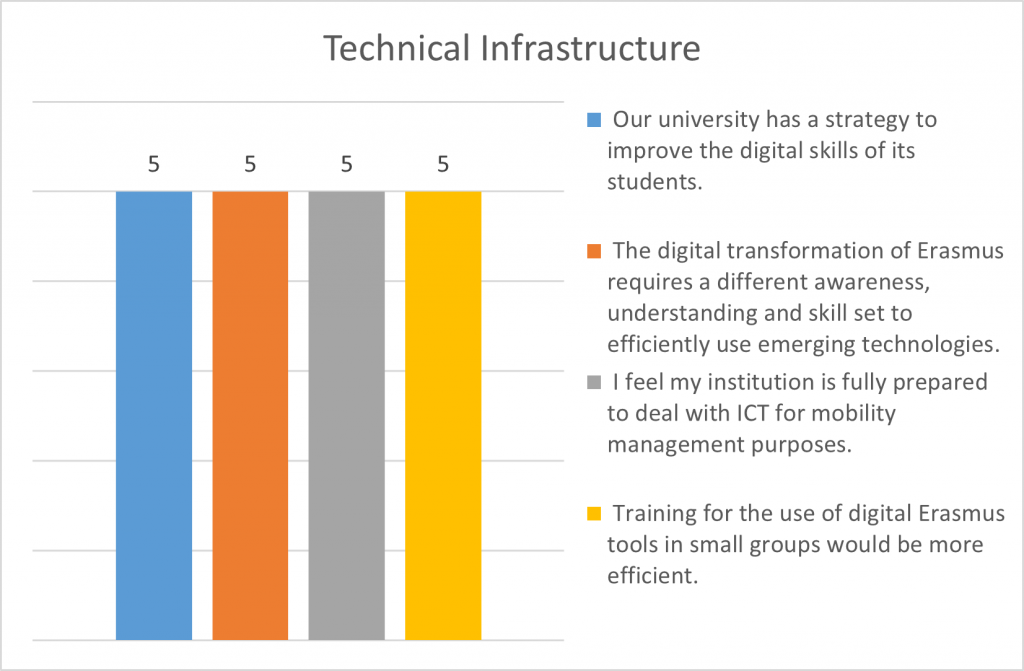
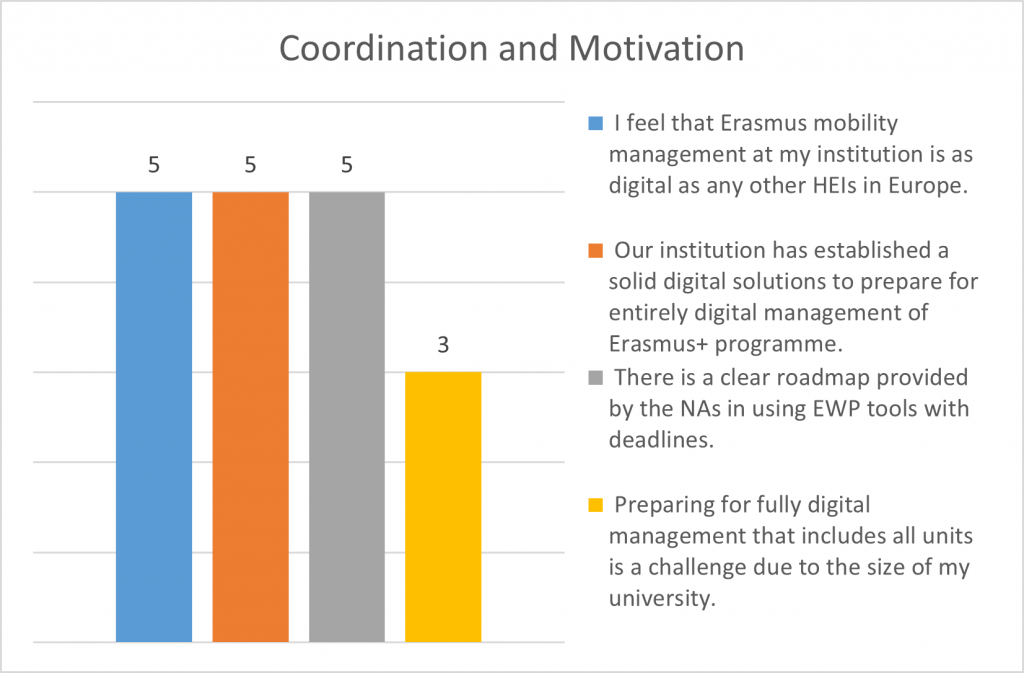
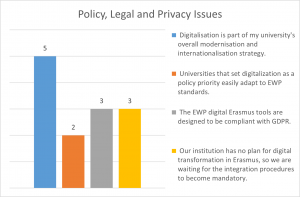
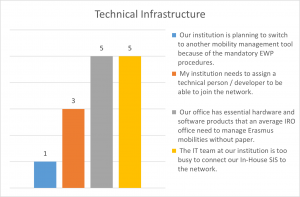
The Calculation of Rates: This visual map is based on the survey carried out under the framework of Output 1 of the SUDTE Project in 2021. The respondents are mainly international relations officers from 18 HEIs in Italy, 21 HEIs in Spain, 65 HEIs in Turkey and 1 HEI in Luxembourg. This number of universities represents at least the 20% of the total HEIs in every participating country. The statistics are calculated here on the basis of respondent’s opinions ranging from strongly disagree to strongly agree on 5-point Likert scale. The idea behind is to allow the readers to compare the digital readiness of the HEIs geographically. The steps of converting the Likert scale into rates are as follows:
- The digitzation process of the likert scale results: Strongly agree (Points: 5) Agree (Points: 4) Neither agree nor disagree (Points: 3) Disagree (Points: 2) Strongly disagree (Points: 1)
- The avarage calculation of the digitized data: For the data from more than one HEIs in the same city